|
Download Data (XLS File) |
|
||||||||
|
||||||||
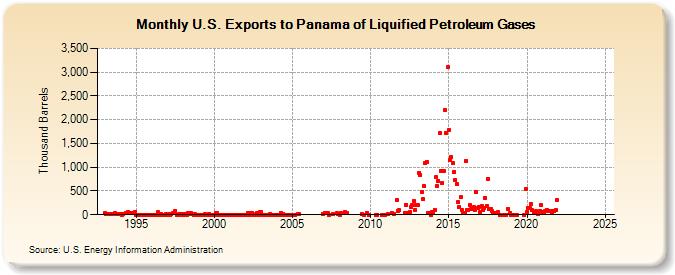
| U.S. Exports to Panama of Liquified Petroleum Gases (Thousand Barrels) | ||||||||
| Year | Jan | Feb | Mar | Apr | May | Jun | Jul | Aug | Sep | Oct | Nov | Dec |
|---|---|---|---|---|---|---|---|---|---|---|---|---|
| 1993 | 34 | 21 | 21 | 22 | 8 | 24 | 12 | 26 | 21 | 21 | ||
| 1994 | 12 | 0 | 11 | 38 | 39 | 56 | 36 | 43 | 30 | 33 | 60 | |
| 1995 | 0 | 0 | 0 | 0 | 0 | 0 | 0 | 0 | 0 | 0 | 1 | 0 |
| 1996 | 0 | 0 | 0 | 0 | 0 | 48 | 0 | 20 | 0 | 0 | 0 | 20 |
| 1997 | 0 | 10 | 0 | 5 | 26 | 29 | 83 | 0 | 0 | 24 | 12 | 0 |
| 1998 | 17 | 0 | 9 | 0 | 38 | 18 | 35 | 22 | 0 | 15 | 0 | 0 |
| 1999 | 0 | 0 | 0 | 0 | 0 | 10 | 0 | 0 | 13 | 0 | 1 | 0 |
| 2000 | 0 | 37 | 34 | 0 | 0 | 0 | 0 | 0 | 0 | 0 | 0 | 0 |
| 2001 | 0 | 0 | 0 | 0 | 0 | 0 | 0 | 0 | 0 | 0 | 0 | 1 |
| 2002 | 0 | 0 | 35 | 0 | 26 | 40 | 0 | 0 | 19 | 26 | 0 | 60 |
| 2003 | 52 | 0 | 0 | 0 | 0 | 0 | 0 | 16 | 0 | 0 | 0 | 0 |
| 2004 | 0 | 0 | 0 | 41 | 0 | 10 | 0 | 0 | 0 | 0 | 0 | 0 |
| 2005 | 0 | 9 | 14 | |||||||||
| 2006 | 20 | |||||||||||
| 2007 | 45 | 33 | 0 | 19 | 31 | 20 | ||||||
| 2008 | 0 | 36 | 52 | 27 | ||||||||
| 2009 | 20 | 0 | 38 | 4 | ||||||||
| 2010 | 0 | 0 | 0 | 0 | 0 | |||||||
| 2011 | 10 | 39 | 11 | 313 | 76 | 98 | ||||||
| 2012 | 38 | 211 | 38 | 38 | 54 | 158 | 201 | 289 | 100 | 199 | ||
| 2013 | 211 | 888 | 845 | 474 | 330 | 596 | 1,090 | 1,118 | 40 | 26 | 4 | 51 |
| 2014 | 42 | 96 | 789 | 601 | 714 | 1,723 | 925 | 668 | 917 | 2,195 | 1,727 | 3,099 |
| 2015 | 1,784 | 1,146 | 1,213 | 1,086 | 907 | 729 | 639 | 258 | 162 | 365 | 96 | 36 |
| 2016 | 41 | 1,136 | 100 | 109 | 197 | 116 | 148 | 162 | 105 | 473 | 137 | 171 |
| 2017 | 66 | 183 | 96 | 136 | 361 | 176 | 758 | 128 | 116 | 84 | 41 | 40 |
| 2018 | 51 | 0 | 0 | 0 | 127 | 27 | ||||||
| 2019 | 1 | 0 | 0 | 0 | 550 | |||||||
| 2020 | 64 | 131 | 136 | 229 | 92 | 63 | 52 | 68 | 15 | 66 | 83 | 202 |
| 2021 | 58 | 64 | 69 | 105 | 71 | 73 | 70 | 38 | 70 | 71 | 103 | 320 |
| 2022 | -- | -- | -- | -- | -- | -- | -- | -- | -- | -- | -- | -- |
| 2023 | -- | -- | -- | -- | -- | -- | -- | -- | -- | -- | -- | -- |
| 2024 | -- | -- | -- | -- | ||||||||
| - = No Data Reported; -- = Not Applicable; NA = Not Available; W = Withheld to avoid disclosure of individual company data. |
| Release Date: 6/28/2024 |
| Next Release Date: 7/31/2024 |