|
Download Data (XLS File) |
|
||||||||
|
||||||||
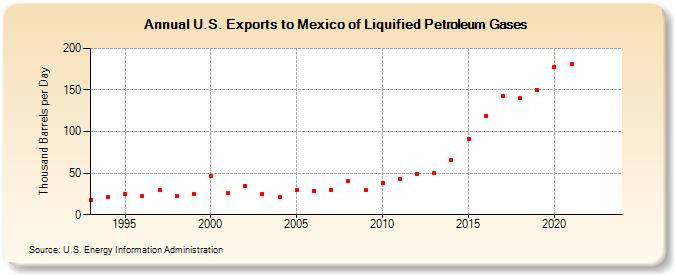
| U.S. Exports to Mexico of Liquified Petroleum Gases (Thousand Barrels per Day) | ||||||||
| Decade | Year-0 | Year-1 | Year-2 | Year-3 | Year-4 | Year-5 | Year-6 | Year-7 | Year-8 | Year-9 |
|---|---|---|---|---|---|---|---|---|---|---|
| 1990's | 18 | 21 | 25 | 23 | 30 | 23 | 25 | |||
| 2000's | 46 | 26 | 35 | 25 | 21 | 30 | 29 | 30 | 40 | 30 |
| 2010's | 38 | 43 | 49 | 50 | 66 | 91 | 119 | 143 | 140 | 150 |
| 2020's | 178 | 181 | -- | -- |
| - = No Data Reported; -- = Not Applicable; NA = Not Available; W = Withheld to avoid disclosure of individual company data. |
| Release Date: 3/29/2024 |
| Next Release Date: 8/30/2024 |