|
Download Data (XLS File) |
|
||||||||
|
||||||||
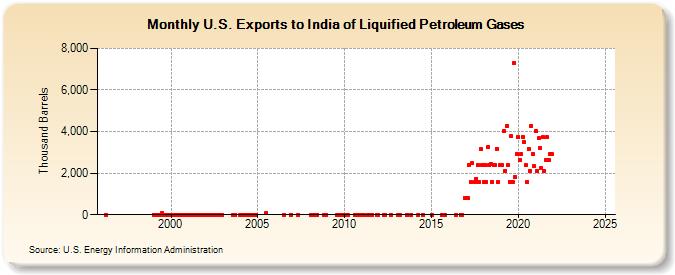
| U.S. Exports to India of Liquified Petroleum Gases (Thousand Barrels) | ||||||||
| Year | Jan | Feb | Mar | Apr | May | Jun | Jul | Aug | Sep | Oct | Nov | Dec |
|---|---|---|---|---|---|---|---|---|---|---|---|---|
| 1996 | 0 | |||||||||||
| 1999 | 0 | 0 | 0 | 0 | 0 | 0 | 83 | 0 | 0 | 0 | 0 | 0 |
| 2000 | 0 | 1 | 1 | 0 | 0 | 0 | 5 | 0 | 3 | 0 | 0 | 0 |
| 2001 | 3 | 0 | 0 | 0 | 0 | 0 | 0 | 0 | 0 | 0 | 0 | 0 |
| 2002 | 1 | 0 | 0 | 0 | 0 | 0 | 0 | 0 | 0 | 0 | 0 | 0 |
| 2003 | 0 | 0 | ||||||||||
| 2004 | 0 | 0 | 0 | 0 | 1 | 0 | 0 | 0 | 0 | 0 | 0 | 0 |
| 2005 | 94 | |||||||||||
| 2006 | 0 | 0 | ||||||||||
| 2007 | 0 | |||||||||||
| 2008 | 0 | 0 | 1 | 0 | 0 | 0 | ||||||
| 2009 | 0 | 0 | 0 | |||||||||
| 2010 | 0 | 0 | 0 | 0 | 0 | 0 | ||||||
| 2011 | 0 | 1 | 0 | 0 | 0 | 0 | 0 | |||||
| 2012 | 0 | 1 | 0 | |||||||||
| 2013 | 0 | 0 | 0 | 0 | ||||||||
| 2014 | 0 | 0 | ||||||||||
| 2015 | 0 | 0 | 0 | |||||||||
| 2016 | 0 | 0 | 0 | 825 | ||||||||
| 2017 | 790 | 790 | 2,374 | 1,578 | 2,472 | 1,585 | 1,741 | 2,379 | 1,587 | 3,169 | 2,376 | |
| 2018 | 1,584 | 2,375 | 1,584 | 3,234 | 2,374 | 2,440 | 1,586 | 2,379 | 2,377 | 3,174 | 1,586 | 2,378 |
| 2019 | 2,377 | 2,378 | 4,020 | 2,119 | 4,271 | 2,381 | 1,583 | 3,779 | 1,586 | 7,301 | 1,825 | 2,931 |
| 2020 | 3,719 | 2,632 | 2,904 | 3,742 | 3,474 | 2,376 | 1,585 | 3,168 | 2,125 | 4,278 | 2,913 | 2,338 |
| 2021 | 4,017 | 2,105 | 3,666 | 3,214 | 2,248 | 3,718 | 2,111 | 2,643 | 3,714 | 2,644 | 2,932 | 2,914 |
| 2022 | -- | -- | -- | -- | -- | -- | -- | -- | -- | -- | -- | -- |
| 2023 | -- | -- | -- | -- | -- | -- | -- | -- | -- | -- | -- | -- |
| 2024 | -- | |||||||||||
| - = No Data Reported; -- = Not Applicable; NA = Not Available; W = Withheld to avoid disclosure of individual company data. |
| Release Date: 3/29/2024 |
| Next Release Date: 4/30/2024 |