|
Download Data (XLS File) |
|
||||||||
|
||||||||
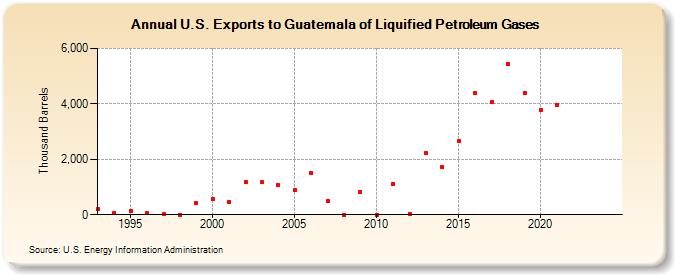
| U.S. Exports to Guatemala of Liquified Petroleum Gases (Thousand Barrels) | ||||||||
| Decade | Year-0 | Year-1 | Year-2 | Year-3 | Year-4 | Year-5 | Year-6 | Year-7 | Year-8 | Year-9 |
|---|---|---|---|---|---|---|---|---|---|---|
| 1990's | 208 | 74 | 143 | 61 | 26 | 2 | 429 | |||
| 2000's | 555 | 473 | 1,178 | 1,180 | 1,063 | 899 | 1,494 | 490 | 2 | 829 |
| 2010's | 1 | 1,114 | 35 | 2,223 | 1,716 | 2,642 | 4,379 | 4,065 | 5,453 | 4,405 |
| 2020's | 3,788 | 3,963 | -- | -- |
| - = No Data Reported; -- = Not Applicable; NA = Not Available; W = Withheld to avoid disclosure of individual company data. |
| Release Date: 3/29/2024 |
| Next Release Date: 8/30/2024 |