|
Download Data (XLS File) |
|
||||||||
|
||||||||
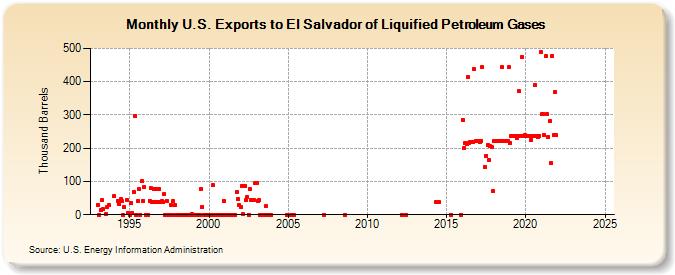
| U.S. Exports to El Salvador of Liquified Petroleum Gases (Thousand Barrels) | ||||||||
| Year | Jan | Feb | Mar | Apr | May | Jun | Jul | Aug | Sep | Oct | Nov | Dec |
|---|---|---|---|---|---|---|---|---|---|---|---|---|
| 1993 | 30 | 0 | 13 | 44 | 16 | 2 | 24 | 28 | ||||
| 1994 | 55 | 42 | 31 | 46 | 41 | 0 | 22 | 45 | 5 | |||
| 1995 | 0 | 35 | 5 | 69 | 296 | 0 | 41 | 76 | 0 | 100 | 42 | 83 |
| 1996 | 0 | 0 | 0 | 42 | 80 | 38 | 77 | 38 | 76 | 38 | 76 | 38 |
| 1997 | 41 | 37 | 63 | 0 | 42 | 0 | 0 | 30 | 0 | 40 | 28 | 0 |
| 1998 | 0 | 0 | 0 | 0 | 0 | 0 | 0 | 0 | 0 | 0 | 0 | 1 |
| 1999 | 0 | 0 | 0 | 0 | 0 | 0 | 77 | 24 | 0 | 0 | 0 | 0 |
| 2000 | 0 | 0 | 0 | 88 | 0 | 0 | 0 | 0 | 0 | 0 | 0 | 42 |
| 2001 | 0 | 0 | 0 | 0 | 0 | 0 | 0 | 0 | 0 | 69 | 46 | 29 |
| 2002 | 24 | 87 | 1 | 87 | 43 | 53 | 0 | 76 | 44 | 44 | 44 | 94 |
| 2003 | 94 | 41 | 44 | 0 | 0 | 0 | 0 | 25 | 0 | 0 | 0 | 0 |
| 2004 | 0 | |||||||||||
| 2005 | 0 | 0 | ||||||||||
| 2007 | 0 | |||||||||||
| 2008 | 0 | |||||||||||
| 2012 | 0 | 0 | ||||||||||
| 2014 | 37 | 37 | ||||||||||
| 2015 | 0 | 0 | ||||||||||
| 2016 | 286 | 200 | 215 | 213 | 414 | 217 | 219 | 219 | 219 | 438 | 221 | 222 |
| 2017 | 222 | 219 | 222 | 443 | 143 | 178 | 209 | 164 | 206 | 205 | 70 | |
| 2018 | 222 | 222 | 222 | 222 | 222 | 221 | 444 | 222 | 222 | 222 | 222 | 443 |
| 2019 | 216 | 237 | 237 | 237 | 237 | 231 | 237 | 371 | 237 | 474 | 237 | 239 |
| 2020 | 237 | 237 | 237 | 237 | 226 | 237 | 237 | 390 | 237 | 235 | 237 | 490 |
| 2021 | 302 | 304 | 239 | 476 | 302 | 235 | 281 | 154 | 478 | 239 | 370 | 239 |
| 2022 | -- | -- | -- | -- | -- | -- | -- | -- | -- | -- | -- | -- |
| 2023 | -- | -- | -- | -- | -- | -- | -- | -- | -- | -- | -- | -- |
| 2024 | -- | -- | -- | -- | ||||||||
| - = No Data Reported; -- = Not Applicable; NA = Not Available; W = Withheld to avoid disclosure of individual company data. |
| Release Date: 6/28/2024 |
| Next Release Date: 7/31/2024 |