|
Download Data (XLS File) |
|
||||||||
|
||||||||
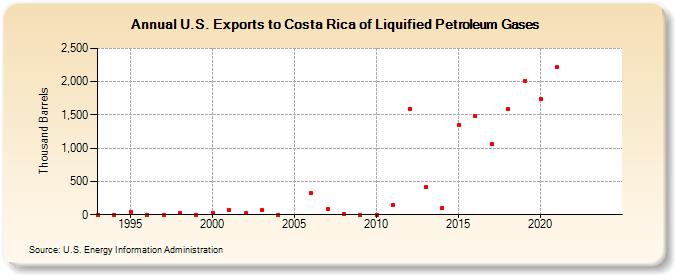
| U.S. Exports to Costa Rica of Liquified Petroleum Gases (Thousand Barrels) | ||||||||
| Decade | Year-0 | Year-1 | Year-2 | Year-3 | Year-4 | Year-5 | Year-6 | Year-7 | Year-8 | Year-9 |
|---|---|---|---|---|---|---|---|---|---|---|
| 1990's | 1 | 1 | 48 | 1 | 0 | 26 | 1 | |||
| 2000's | 30 | 65 | 20 | 78 | 0 | 325 | 81 | 5 | 2 | |
| 2010's | 2 | 152 | 1,593 | 416 | 105 | 1,349 | 1,486 | 1,060 | 1,585 | 2,010 |
| 2020's | 1,739 | 2,219 | -- | -- |
| - = No Data Reported; -- = Not Applicable; NA = Not Available; W = Withheld to avoid disclosure of individual company data. |
| Release Date: 3/29/2024 |
| Next Release Date: 8/30/2024 |