|
Download Data (XLS File) |
|
||||||||
|
||||||||
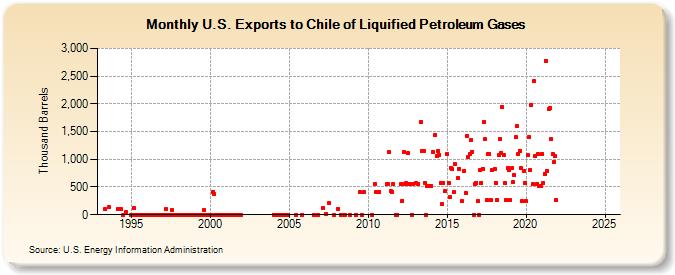
| U.S. Exports to Chile of Liquified Petroleum Gases (Thousand Barrels) | ||||||||
| Year | Jan | Feb | Mar | Apr | May | Jun | Jul | Aug | Sep | Oct | Nov | Dec |
|---|---|---|---|---|---|---|---|---|---|---|---|---|
| 1993 | 97 | 134 | ||||||||||
| 1994 | 101 | 103 | 100 | 0 | 47 | |||||||
| 1995 | 0 | 0 | 113 | 0 | 0 | 0 | 0 | 0 | 0 | 0 | 0 | 0 |
| 1996 | 0 | 0 | 0 | 0 | 0 | 0 | 0 | 0 | 1 | 0 | 0 | 0 |
| 1997 | 0 | 0 | 104 | 0 | 0 | 0 | 0 | 82 | 0 | 0 | 0 | 0 |
| 1998 | 0 | 0 | 0 | 0 | 0 | 0 | 0 | 1 | 0 | 0 | 0 | 0 |
| 1999 | 1 | 0 | 0 | 0 | 0 | 0 | 0 | 81 | 0 | 0 | 0 | 0 |
| 2000 | 0 | 0 | 412 | 375 | 0 | 0 | 1 | 0 | 0 | 0 | 0 | 0 |
| 2001 | 0 | 0 | 0 | 2 | 0 | 0 | 0 | 0 | 0 | 0 | 0 | 0 |
| 2004 | 0 | 0 | 0 | 0 | 0 | 0 | 0 | 0 | 0 | 0 | 0 | 0 |
| 2005 | 0 | 0 | ||||||||||
| 2006 | 0 | 1 | ||||||||||
| 2007 | 127 | 20 | 204 | 2 | ||||||||
| 2008 | 112 | 0 | 0 | 0 | 0 | |||||||
| 2009 | 0 | 411 | 0 | 416 | ||||||||
| 2010 | 0 | 556 | 410 | 410 | 410 | |||||||
| 2011 | 550 | 550 | 1,128 | 422 | 410 | 550 | 0 | 0 | ||||
| 2012 | 550 | 252 | 1,128 | 550 | 575 | 1,108 | 550 | 550 | 0 | 562 | ||
| 2013 | 575 | 560 | 1,675 | 1,150 | 1,146 | 575 | 0 | 525 | 525 | |||
| 2014 | 525 | 1,127 | 1,435 | 1,068 | 1,145 | 1,082 | 577 | 196 | 573 | 421 | ||
| 2015 | 1,098 | 575 | 312 | 836 | 819 | 406 | 921 | 659 | 830 | 243 | ||
| 2016 | 796 | 395 | 1,412 | 1,037 | 1,091 | 1,350 | 1,136 | 0 | 549 | 577 | 249 | |
| 2017 | 0 | 801 | 577 | 832 | 1,670 | 1,357 | 259 | 1,099 | 1,096 | 261 | 811 | |
| 2018 | 833 | 577 | 261 | 1,073 | 1,373 | 1,121 | 1,943 | 1,078 | 577 | 261 | 838 | 812 |
| 2019 | 261 | 841 | 583 | 713 | 1,394 | 1,592 | 1,102 | 1,152 | 837 | 245 | 796 | 577 |
| 2020 | 240 | 1,069 | 1,399 | 811 | 1,980 | 551 | 2,404 | 1,053 | 545 | 1,091 | 512 | 517 |
| 2021 | 1,104 | 576 | 737 | 2,778 | 793 | 1,906 | 1,922 | 1,363 | 1,090 | 950 | 1,062 | 266 |
| 2022 | -- | -- | -- | -- | -- | -- | -- | -- | -- | -- | -- | -- |
| 2023 | -- | -- | -- | -- | -- | -- | -- | -- | -- | -- | -- | -- |
| 2024 | -- | -- | -- | -- | ||||||||
| - = No Data Reported; -- = Not Applicable; NA = Not Available; W = Withheld to avoid disclosure of individual company data. |
| Release Date: 6/28/2024 |
| Next Release Date: 7/31/2024 |