|
Download Data (XLS File) |
|
||||||||
|
||||||||
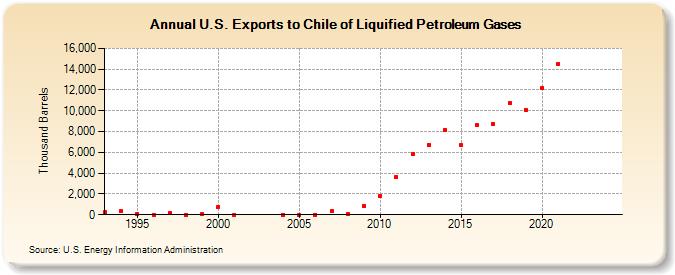
| U.S. Exports to Chile of Liquified Petroleum Gases (Thousand Barrels) | ||||||||
| Decade | Year-0 | Year-1 | Year-2 | Year-3 | Year-4 | Year-5 | Year-6 | Year-7 | Year-8 | Year-9 |
|---|---|---|---|---|---|---|---|---|---|---|
| 1990's | 231 | 351 | 113 | 1 | 186 | 1 | 82 | |||
| 2000's | 787 | 2 | 1 | 1 | 1 | 353 | 113 | 827 | ||
| 2010's | 1,786 | 3,610 | 5,825 | 6,731 | 8,149 | 6,700 | 8,593 | 8,764 | 10,747 | 10,092 |
| 2020's | 12,171 | 14,546 | -- | -- |
| - = No Data Reported; -- = Not Applicable; NA = Not Available; W = Withheld to avoid disclosure of individual company data. |
| Release Date: 3/29/2024 |
| Next Release Date: 8/30/2024 |