|
Download Data (XLS File) |
|
||||||||
|
||||||||
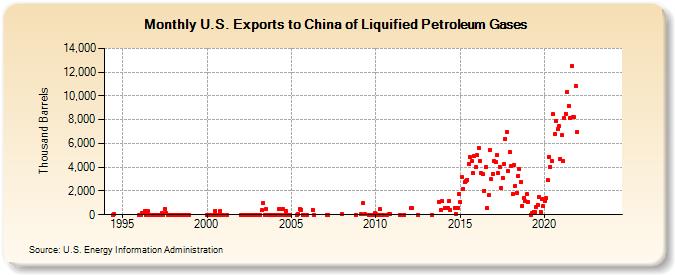
| U.S. Exports to China of Liquified Petroleum Gases (Thousand Barrels) | ||||||||
| Year | Jan | Feb | Mar | Apr | May | Jun | Jul | Aug | Sep | Oct | Nov | Dec |
|---|---|---|---|---|---|---|---|---|---|---|---|---|
| 1994 | 0 | 31 | ||||||||||
| 1996 | 0 | 0 | 114 | 114 | 347 | 0 | 275 | 0 | 1 | 1 | 0 | 0 |
| 1997 | 0 | 0 | 0 | 0 | 131 | 0 | 521 | 120 | 0 | 0 | 0 | 0 |
| 1998 | 0 | 0 | 0 | 0 | 0 | 0 | 0 | 0 | 0 | 0 | 0 | 1 |
| 2000 | 0 | 0 | 0 | 0 | 0 | 0 | 340 | 0 | 0 | 280 | 0 | 0 |
| 2001 | 0 | |||||||||||
| 2002 | 0 | 0 | 0 | 0 | 0 | 0 | 0 | 0 | 0 | 2 | 0 | 0 |
| 2003 | 2 | 0 | 0 | 374 | 980 | 0 | 475 | 0 | 3 | 3 | 0 | 0 |
| 2004 | 0 | 0 | 0 | 478 | 4 | 494 | 511 | 0 | 300 | 0 | 0 | 0 |
| 2005 | 3 | 33 | 464 | 435 | 0 | 0 | 0 | |||||
| 2006 | 421 | 0 | ||||||||||
| 2007 | 0 | 0 | ||||||||||
| 2008 | 25 | 0 | ||||||||||
| 2009 | 23 | 969 | 46 | 0 | 0 | 0 | 121 | |||||
| 2010 | 58 | 0 | 1 | 455 | 1 | 0 | 0 | 29 | 41 | |||
| 2011 | 0 | 0 | ||||||||||
| 2012 | 550 | 550 | 0 | |||||||||
| 2013 | 1 | 1,105 | 389 | 1,154 | ||||||||
| 2014 | 577 | 577 | 574 | 1,159 | 410 | 577 | 52 | 577 | 1,711 | |||
| 2015 | 1,090 | 3,165 | 2,167 | 2,727 | 2,814 | 2,959 | 4,305 | 4,855 | 4,507 | 3,489 | 4,903 | 4,027 |
| 2016 | 4,996 | 5,614 | 4,547 | 3,479 | 3,392 | 2,029 | 3,987 | 576 | 1,620 | 5,468 | 2,968 | 3,468 |
| 2017 | 4,521 | 4,424 | 5,016 | 3,498 | 4,009 | 2,250 | 3,103 | 4,252 | 6,395 | 6,972 | 3,681 | 5,293 |
| 2018 | 4,137 | 1,731 | 4,195 | 2,453 | 1,861 | 3,282 | 3,825 | 2,779 | 764 | 1,413 | 1,130 | 1,704 |
| 2019 | 1,083 | 0 | 152 | 263 | 262 | 684 | 840 | 1,493 | 265 | 1,353 | 709 | |
| 2020 | 1,143 | 1,383 | 2,920 | 4,885 | 4,037 | 4,535 | 8,446 | 6,813 | 7,898 | 7,187 | 7,429 | 4,721 |
| 2021 | 6,668 | 4,528 | 8,110 | 8,500 | 10,357 | 9,185 | 8,127 | 12,513 | 8,217 | 8,202 | 10,853 | 6,934 |
| 2022 | -- | -- | -- | -- | -- | -- | -- | -- | -- | -- | -- | -- |
| 2023 | -- | -- | -- | -- | -- | -- | -- | -- | -- | -- | -- | -- |
| 2024 | -- | -- | -- | -- | ||||||||
| - = No Data Reported; -- = Not Applicable; NA = Not Available; W = Withheld to avoid disclosure of individual company data. |
| Release Date: 6/28/2024 |
| Next Release Date: 7/31/2024 |