|
Download Data (XLS File) |
|
||||||||
|
||||||||
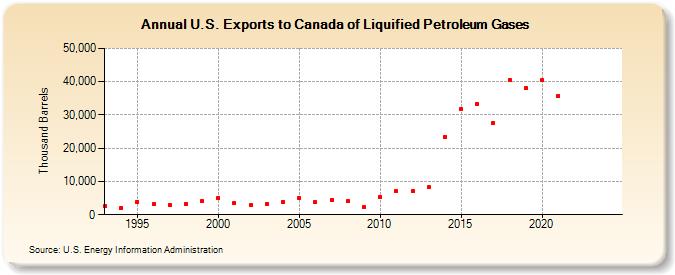
| U.S. Exports to Canada of Liquified Petroleum Gases (Thousand Barrels) | ||||||||
| Decade | Year-0 | Year-1 | Year-2 | Year-3 | Year-4 | Year-5 | Year-6 | Year-7 | Year-8 | Year-9 |
|---|---|---|---|---|---|---|---|---|---|---|
| 1990's | 2,517 | 2,038 | 3,917 | 3,189 | 2,871 | 3,293 | 3,997 | |||
| 2000's | 5,069 | 3,509 | 2,914 | 3,358 | 3,803 | 4,888 | 3,737 | 4,549 | 4,025 | 2,174 |
| 2010's | 5,338 | 6,979 | 6,994 | 8,219 | 23,500 | 31,769 | 33,310 | 27,579 | 40,537 | 38,162 |
| 2020's | 40,419 | 35,789 | -- | -- |
| - = No Data Reported; -- = Not Applicable; NA = Not Available; W = Withheld to avoid disclosure of individual company data. |
| Release Date: 3/29/2024 |
| Next Release Date: 8/30/2024 |