|
Download Data (XLS File) |
|
||||||||
|
||||||||
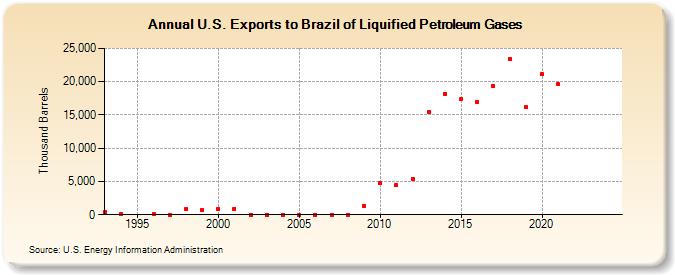
| U.S. Exports to Brazil of Liquified Petroleum Gases (Thousand Barrels) | ||||||||
| Decade | Year-0 | Year-1 | Year-2 | Year-3 | Year-4 | Year-5 | Year-6 | Year-7 | Year-8 | Year-9 |
|---|---|---|---|---|---|---|---|---|---|---|
| 1990's | 435 | 37 | 117 | 1 | 842 | 743 | ||||
| 2000's | 877 | 901 | 4 | 2 | 2 | 1 | 2 | 3 | 3 | 1,379 |
| 2010's | 4,758 | 4,408 | 5,443 | 15,512 | 18,160 | 17,335 | 16,900 | 19,296 | 23,468 | 16,216 |
| 2020's | 21,182 | 19,600 | -- | -- |
| - = No Data Reported; -- = Not Applicable; NA = Not Available; W = Withheld to avoid disclosure of individual company data. |
| Release Date: 6/28/2024 |
| Next Release Date: 8/30/2024 |