|
Download Data (XLS File) |
|
||||||||
|
||||||||
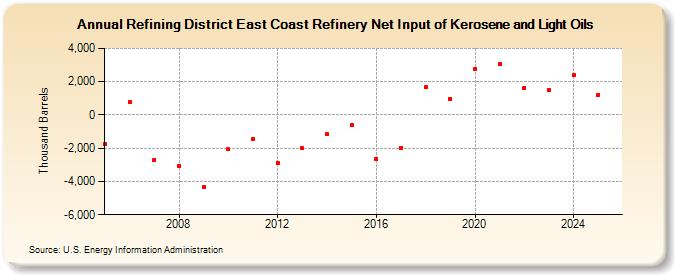
| Refining District East Coast Refinery Net Input of Kerosene and Light Oils (Thousand Barrels) | ||||||||
| Decade | Year-0 | Year-1 | Year-2 | Year-3 | Year-4 | Year-5 | Year-6 | Year-7 | Year-8 | Year-9 |
|---|---|---|---|---|---|---|---|---|---|---|
| 2000's | -1,752 | 773 | -2,693 | -3,052 | -4,329 | |||||
| 2010's | -2,069 | -1,419 | -2,867 | -2,009 | -1,166 | -620 | -2,659 | -1,987 | 1,650 | 959 |
| 2020's | 2,767 | 3,067 | 1,640 | 1,521 |
| - = No Data Reported; -- = Not Applicable; NA = Not Available; W = Withheld to avoid disclosure of individual company data. |
| Release Date: 6/28/2024 |
| Next Release Date: 8/30/2024 |