|
Download Data (XLS File) |
|
||||||||
|
||||||||
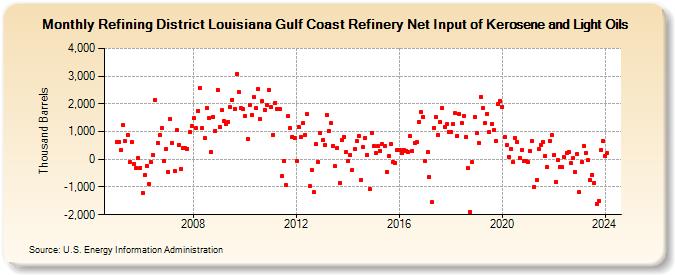
| Refining District Louisiana Gulf Coast Refinery Net Input of Kerosene and Light Oils (Thousand Barrels) | ||||||||
| Year | Jan | Feb | Mar | Apr | May | Jun | Jul | Aug | Sep | Oct | Nov | Dec |
|---|---|---|---|---|---|---|---|---|---|---|---|---|
| 2005 | 638 | 638 | 334 | 1,226 | 642 | 878 | -109 | 620 | -176 | -324 | 40 | -305 |
| 2006 | -1,210 | -563 | -230 | -880 | -108 | 149 | 2,135 | 582 | 867 | 1,134 | -75 | 364 |
| 2007 | -448 | 1,456 | 590 | -416 | 1,048 | 530 | -351 | 395 | 396 | 382 | 980 | 1,200 |
| 2008 | 1,471 | 1,124 | 1,757 | 2,567 | 1,120 | 754 | 1,847 | 1,489 | 253 | 1,538 | 1,036 | 2,516 |
| 2009 | 1,168 | 1,763 | 1,371 | 1,256 | 1,349 | 1,878 | 2,152 | 1,827 | 3,073 | 2,416 | 1,839 | 1,804 |
| 2010 | 1,569 | 725 | 1,956 | 1,611 | 2,252 | 1,842 | 2,524 | 1,448 | 2,091 | 1,787 | 1,967 | 2,499 |
| 2011 | 1,879 | 890 | 2,034 | 1,827 | 1,814 | -620 | -58 | -940 | 1,544 | 1,112 | 819 | 759 |
| 2012 | -46 | 1,159 | 795 | 1,301 | 882 | 1,616 | -978 | -370 | -1,198 | 539 | -102 | 944 |
| 2013 | 695 | 512 | 1,609 | 1,035 | 1,303 | 493 | -255 | 405 | -850 | 695 | 820 | 265 |
| 2014 | -53 | 156 | -382 | 362 | 656 | 846 | -757 | 435 | 785 | 163 | -1,074 | 949 |
| 2015 | 475 | 224 | 469 | 307 | 534 | 461 | -447 | 127 | 550 | -98 | -119 | 334 |
| 2016 | 343 | 233 | 349 | 313 | 273 | 844 | 303 | 589 | 609 | 1,348 | 1,721 | 1,517 |
| 2017 | -76 | 252 | -636 | -1,558 | 1,139 | 1,513 | 892 | 1,360 | 1,863 | 1,168 | 1,263 | 994 |
| 2018 | 995 | 1,258 | 1,652 | 851 | 1,625 | 1,308 | 1,579 | 808 | -318 | -1,902 | -105 | 1,531 |
| 2019 | 952 | 604 | 2,264 | 1,848 | 1,292 | 1,651 | 966 | 1,269 | 1,053 | 669 | 2,001 | 2,110 |
| 2020 | 1,903 | 811 | 511 | 91 | 385 | -108 | 777 | 621 | 52 | 349 | -67 | -48 |
| 2021 | -114 | 301 | 661 | -985 | -756 | 354 | 526 | 625 | 120 | -292 | 667 | 872 |
| 2022 | 138 | -828 | -35 | -275 | -293 | 68 | 235 | 267 | -152 | 37 | -455 | 182 |
| 2023 | -1,198 | -100 | 480 | 228 | -28 | -751 | -559 | -849 | -1,600 | -1,496 | 320 | 664 |
| 2024 | 105 | |||||||||||
| - = No Data Reported; -- = Not Applicable; NA = Not Available; W = Withheld to avoid disclosure of individual company data. |
| Release Date: 3/29/2024 |
| Next Release Date: 4/30/2024 |