|
Download Data (XLS File) |
|
||||||||
|
||||||||
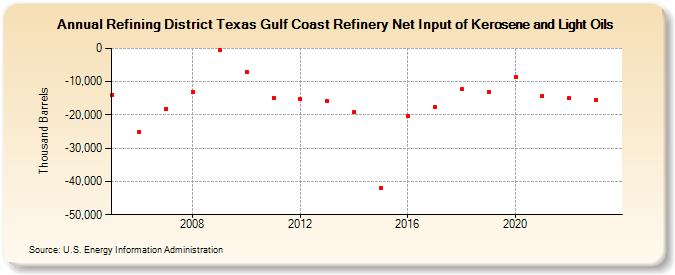
| Refining District Texas Gulf Coast Refinery Net Input of Kerosene and Light Oils (Thousand Barrels) | ||||||||
| Decade | Year-0 | Year-1 | Year-2 | Year-3 | Year-4 | Year-5 | Year-6 | Year-7 | Year-8 | Year-9 |
|---|---|---|---|---|---|---|---|---|---|---|
| 2000's | -13,874 | -25,198 | -18,105 | -13,064 | -449 | |||||
| 2010's | -7,101 | -14,782 | -15,264 | -15,952 | -19,128 | -42,018 | -20,467 | -17,533 | -12,327 | -13,046 |
| 2020's | -8,586 | -14,221 | -15,062 | -18,864 | -26,194 |
| - = No Data Reported; -- = Not Applicable; NA = Not Available; W = Withheld to avoid disclosure of individual company data. |
| Release Date: 6/30/2025 |
| Next Release Date: 8/29/2025 |