|
Download Data (XLS File) |
|
||||||||
|
||||||||
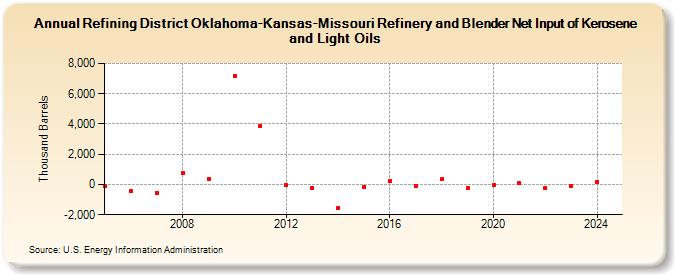
| Refining District Oklahoma-Kansas-Missouri Refinery and Blender Net Input of Kerosene and Light Oils (Thousand Barrels) | ||||||||
| Decade | Year-0 | Year-1 | Year-2 | Year-3 | Year-4 | Year-5 | Year-6 | Year-7 | Year-8 | Year-9 |
|---|---|---|---|---|---|---|---|---|---|---|
| 2000's | -127 | -403 | -538 | 779 | 352 | |||||
| 2010's | 7,184 | 3,879 | -38 | -227 | -1,561 | -148 | 206 | -98 | 343 | -257 |
| 2020's | -6 | 86 | -207 | -89 | 196 |
| - = No Data Reported; -- = Not Applicable; NA = Not Available; W = Withheld to avoid disclosure of individual company data. |
| Release Date: 6/30/2025 |
| Next Release Date: 8/29/2025 |