|
Download Data (XLS File) |
|
||||||||
|
||||||||
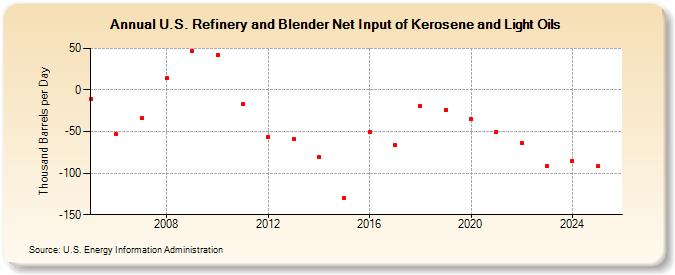
| U.S. Refinery and Blender Net Input of Kerosene and Light Oils (Thousand Barrels per Day) | ||||||||
| Decade | Year-0 | Year-1 | Year-2 | Year-3 | Year-4 | Year-5 | Year-6 | Year-7 | Year-8 | Year-9 |
|---|---|---|---|---|---|---|---|---|---|---|
| 2000's | -11 | -53 | -34 | 14 | 47 | |||||
| 2010's | 42 | -17 | -57 | -59 | -81 | -130 | -50 | -66 | -19 | -24 |
| 2020's | -35 | -50 | -64 | -83 |
| - = No Data Reported; -- = Not Applicable; NA = Not Available; W = Withheld to avoid disclosure of individual company data. |
| Release Date: 3/29/2024 |
| Next Release Date: 8/30/2024 |