|
Download Data (XLS File) |
|
||||||||
|
||||||||
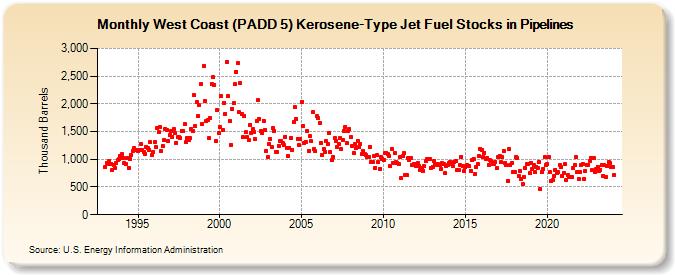
| West Coast (PADD 5) Kerosene-Type Jet Fuel Stocks in Pipelines (Thousand Barrels) | ||||||||
| Year | Jan | Feb | Mar | Apr | May | Jun | Jul | Aug | Sep | Oct | Nov | Dec |
|---|---|---|---|---|---|---|---|---|---|---|---|---|
| 1993 | 856 | 939 | 909 | 969 | 920 | 798 | 889 | 847 | 930 | 980 | 996 | 1,061 |
| 1994 | 1,092 | 1,028 | 926 | 913 | 1,021 | 848 | 998 | 1,074 | 1,150 | 1,195 | 1,175 | 1,162 |
| 1995 | 1,154 | 1,167 | 1,277 | 1,173 | 1,133 | 1,102 | 1,228 | 1,212 | 1,176 | 1,305 | 1,086 | 1,138 |
| 1996 | 1,307 | 1,221 | 1,558 | 1,495 | 1,579 | 1,148 | 1,248 | 1,340 | 1,555 | 1,537 | 1,337 | 1,437 |
| 1997 | 1,509 | 1,408 | 1,538 | 1,471 | 1,295 | 1,400 | 1,397 | 1,381 | 1,516 | 1,501 | 1,631 | 1,304 |
| 1998 | 1,383 | 1,356 | 1,381 | 1,549 | 1,506 | 2,159 | 1,600 | 2,029 | 1,778 | 1,971 | 2,351 | 1,638 |
| 1999 | 2,685 | 2,058 | 1,694 | 1,715 | 1,377 | 1,740 | 2,357 | 2,475 | 2,342 | 1,323 | 1,888 | 1,482 |
| 2000 | 1,584 | 2,139 | 1,537 | 2,019 | 1,823 | 2,759 | 2,136 | 1,686 | 1,266 | 1,915 | 2,009 | 2,353 |
| 2001 | 2,583 | 2,736 | 1,846 | 2,367 | 1,810 | 1,393 | 1,778 | 1,486 | 1,394 | 1,343 | 1,626 | 1,476 |
| 2002 | 1,539 | 1,493 | 1,357 | 1,696 | 2,061 | 1,724 | 1,508 | 1,468 | 1,698 | 1,535 | 1,151 | 1,039 |
| 2003 | 1,279 | 1,368 | 1,221 | 1,557 | 1,510 | 1,137 | 1,127 | 1,247 | 1,337 | 1,321 | 1,293 | 1,253 |
| 2004 | 1,408 | 1,206 | 1,064 | 1,211 | 1,390 | 1,173 | 1,668 | 1,936 | 1,730 | 1,366 | 1,259 | 1,365 |
| 2005 | 2,039 | 1,603 | 1,299 | 1,318 | 1,504 | 1,150 | 1,414 | 1,325 | 1,846 | 1,181 | 1,143 | 1,772 |
| 2006 | 1,743 | 1,652 | 1,293 | 1,081 | 1,182 | 1,138 | 1,321 | 1,267 | 1,482 | 1,126 | 991 | 1,039 |
| 2007 | 1,378 | 1,326 | 1,226 | 1,268 | 1,378 | 1,190 | 1,348 | 1,510 | 1,588 | 1,290 | 1,503 | 1,544 |
| 2008 | 1,401 | 1,248 | 1,117 | 1,268 | 1,196 | 1,336 | 1,217 | 1,269 | 1,102 | 1,151 | 1,093 | 1,075 |
| 2009 | 1,050 | 1,038 | 1,229 | 942 | 953 | 1,060 | 846 | 1,069 | 947 | 829 | 1,047 | 1,003 |
| 2010 | 995 | 1,109 | 1,115 | 1,094 | 1,063 | 872 | 1,193 | 936 | 1,108 | 951 | 939 | 908 |
| 2011 | 1,041 | 662 | 1,055 | 1,114 | 713 | 711 | 1,028 | 992 | 1,020 | 895 | 917 | 919 |
| 2012 | 870 | 930 | 884 | 814 | 842 | 793 | 871 | 964 | 997 | 1,002 | 1,002 | 849 |
| 2013 | 864 | 966 | 915 | 903 | 911 | 888 | 821 | 925 | 914 | 744 | 881 | 895 |
| 2014 | 936 | 954 | 917 | 875 | 956 | 970 | 807 | 811 | 890 | 1,046 | 870 | 792 |
| 2015 | 854 | 895 | 875 | 877 | 797 | 980 | 1,012 | 742 | 861 | 910 | 1,053 | 1,194 |
| 2016 | 1,160 | 1,044 | 1,120 | 996 | 1,023 | 894 | 986 | 960 | 914 | 911 | 953 | 839 |
| 2017 | 1,033 | 1,063 | 946 | 1,037 | 1,145 | 933 | 893 | 613 | 1,179 | 898 | 941 | 766 |
| 2018 | 770 | 1,038 | 1,031 | 694 | 794 | 652 | 550 | 682 | 841 | 911 | 922 | 744 |
| 2019 | 941 | 824 | 895 | 768 | 862 | 837 | 949 | 456 | 769 | 833 | 1,036 | 891 |
| 2020 | 912 | 1,033 | 766 | 605 | 620 | 699 | 812 | 758 | 764 | 890 | 859 | 706 |
| 2021 | 756 | 909 | 629 | 716 | 688 | 677 | 674 | 843 | 894 | 1,040 | 763 | 642 |
| 2022 | 778 | 896 | 915 | 643 | 791 | 905 | 899 | 969 | 1,028 | 801 | 1,020 | 769 |
| 2023 | 817 | 867 | 792 | 807 | 903 | 704 | 891 | 686 | 885 | 953 | 932 | 854 |
| 2024 | 853 | |||||||||||
| - = No Data Reported; -- = Not Applicable; NA = Not Available; W = Withheld to avoid disclosure of individual company data. |
| Release Date: 3/29/2024 |
| Next Release Date: 4/30/2024 |