|
Download Data (XLS File) |
|
||||||||
|
||||||||
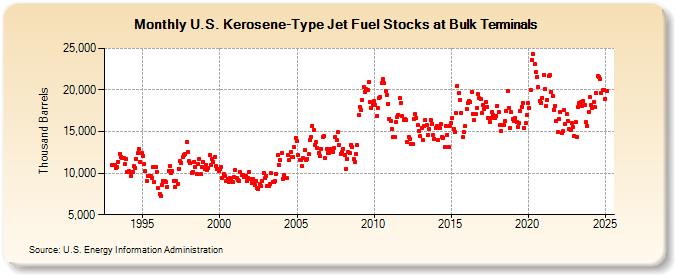
| U.S. Kerosene-Type Jet Fuel Stocks at Bulk Terminals (Thousand Barrels) | ||||||||
| Year | Jan | Feb | Mar | Apr | May | Jun | Jul | Aug | Sep | Oct | Nov | Dec |
|---|---|---|---|---|---|---|---|---|---|---|---|---|
| 1993 | 10,924 | 10,948 | 10,971 | 10,637 | 10,688 | 11,390 | 12,322 | 11,994 | 11,799 | 11,778 | 11,094 | 11,672 |
| 1994 | 10,138 | 10,274 | 10,087 | 9,669 | 10,196 | 10,809 | 10,674 | 11,697 | 12,365 | 12,951 | 11,390 | 12,373 |
| 1995 | 12,031 | 11,150 | 10,226 | 9,025 | 9,645 | 9,596 | 9,698 | 9,448 | 10,764 | 8,918 | 10,730 | 10,154 |
| 1996 | 8,165 | 7,545 | 7,298 | 8,624 | 9,030 | 9,017 | 8,936 | 8,384 | 10,310 | 10,869 | 9,974 | 10,242 |
| 1997 | 9,089 | 8,284 | 9,078 | 8,686 | 10,541 | 11,418 | 11,277 | 11,908 | 12,232 | 12,264 | 13,739 | 12,483 |
| 1998 | 11,476 | 11,161 | 10,030 | 10,143 | 11,376 | 10,748 | 9,860 | 11,068 | 11,710 | 9,876 | 10,770 | 11,369 |
| 1999 | 10,506 | 11,009 | 10,413 | 10,622 | 12,158 | 10,920 | 11,730 | 11,386 | 11,972 | 10,816 | 10,458 | 10,213 |
| 2000 | 10,504 | 10,747 | 9,438 | 9,840 | 9,657 | 9,097 | 9,329 | 8,961 | 9,374 | 9,217 | 8,898 | 9,489 |
| 2001 | 10,388 | 9,440 | 9,198 | 9,087 | 10,111 | 9,743 | 9,816 | 9,500 | 9,704 | 9,032 | 9,443 | 10,150 |
| 2002 | 9,342 | 8,839 | 9,255 | 8,623 | 9,001 | 8,207 | 8,086 | 8,726 | 8,425 | 9,045 | 10,066 | 9,377 |
| 2003 | 9,659 | 8,469 | 8,487 | 8,675 | 9,976 | 8,879 | 8,885 | 9,089 | 9,941 | 12,150 | 11,005 | 11,552 |
| 2004 | 12,437 | 9,333 | 9,718 | 9,363 | 9,380 | 12,162 | 11,606 | 12,508 | 11,989 | 11,880 | 13,097 | 14,278 |
| 2005 | 13,804 | 12,145 | 11,580 | 11,549 | 10,876 | 11,879 | 12,752 | 11,564 | 11,716 | 12,265 | 13,969 | 14,364 |
| 2006 | 15,703 | 15,188 | 13,398 | 13,688 | 12,979 | 12,477 | 12,018 | 12,954 | 14,354 | 14,415 | 11,805 | 12,880 |
| 2007 | 12,464 | 12,451 | 12,937 | 12,633 | 12,485 | 13,062 | 14,395 | 13,941 | 14,908 | 13,362 | 12,353 | 12,505 |
| 2008 | 12,917 | 12,150 | 10,544 | 11,683 | 12,538 | 12,376 | 13,416 | 13,150 | 11,722 | 11,368 | 12,247 | 13,369 |
| 2009 | 17,013 | 17,930 | 17,578 | 18,834 | 20,306 | 19,706 | 20,078 | 19,995 | 20,942 | 18,524 | 17,802 | 18,167 |
| 2010 | 18,621 | 18,193 | 16,814 | 17,805 | 19,042 | 19,198 | 20,832 | 21,287 | 20,799 | 19,875 | 19,454 | 18,371 |
| 2011 | 16,563 | 16,291 | 15,278 | 14,299 | 14,362 | 16,128 | 16,708 | 17,038 | 19,052 | 18,429 | 16,882 | 16,449 |
| 2012 | 16,536 | 16,394 | 13,735 | 14,325 | 14,063 | 13,492 | 13,546 | 16,470 | 17,110 | 16,656 | 15,757 | 15,056 |
| 2013 | 14,460 | 15,426 | 13,990 | 15,713 | 16,445 | 15,785 | 14,600 | 15,331 | 16,372 | 15,941 | 14,560 | 14,127 |
| 2014 | 15,436 | 15,642 | 13,946 | 15,388 | 15,885 | 14,402 | 14,246 | 13,146 | 15,702 | 14,620 | 13,143 | 15,697 |
| 2015 | 16,033 | 16,673 | 15,293 | 14,901 | 17,220 | 20,500 | 19,620 | 18,842 | 17,249 | 14,302 | 14,939 | 15,624 |
| 2016 | 17,729 | 18,438 | 18,654 | 18,536 | 19,729 | 17,118 | 16,339 | 17,137 | 17,839 | 19,508 | 18,979 | 18,908 |
| 2017 | 17,239 | 18,229 | 17,732 | 18,579 | 18,011 | 16,620 | 16,192 | 16,680 | 17,340 | 16,974 | 16,574 | 16,928 |
| 2018 | 18,118 | 17,378 | 15,779 | 15,107 | 15,767 | 15,757 | 16,296 | 17,462 | 19,903 | 17,851 | 15,407 | 17,302 |
| 2019 | 16,450 | 16,261 | 16,636 | 16,135 | 15,562 | 15,977 | 17,414 | 17,992 | 18,490 | 15,429 | 15,993 | 17,004 |
| 2020 | 18,443 | 17,877 | 19,984 | 23,619 | 24,360 | 23,080 | 22,156 | 21,612 | 20,356 | 18,641 | 18,447 | 19,077 |
| 2021 | 21,851 | 20,141 | 18,024 | 18,841 | 21,688 | 21,784 | 19,780 | 19,279 | 17,641 | 18,092 | 16,244 | 14,928 |
| 2022 | 16,523 | 17,410 | 14,825 | 15,014 | 17,561 | 15,955 | 17,114 | 16,286 | 15,250 | 15,174 | 16,010 | 15,537 |
| 2023 | 14,408 | 16,219 | 14,323 | 17,964 | 18,487 | 18,648 | 18,153 | 18,684 | 18,155 | 16,139 | 15,616 | 17,366 |
| 2024 | 19,117 | |||||||||||
| - = No Data Reported; -- = Not Applicable; NA = Not Available; W = Withheld to avoid disclosure of individual company data. |
| Release Date: 3/29/2024 |
| Next Release Date: 4/30/2024 |