|
Download Data (XLS File) |
|
||||||||
|
||||||||
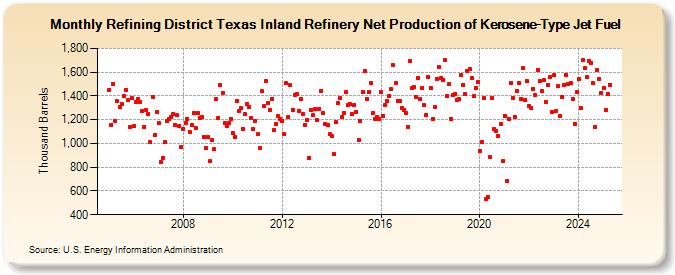
| Refining District Texas Inland Refinery Net Production of Kerosene-Type Jet Fuel (Thousand Barrels) | ||||||||
| Year | Jan | Feb | Mar | Apr | May | Jun | Jul | Aug | Sep | Oct | Nov | Dec |
|---|---|---|---|---|---|---|---|---|---|---|---|---|
| 2005 | 1,453 | 1,156 | 1,498 | 1,188 | 1,353 | 1,303 | 1,331 | 1,398 | 1,453 | 1,362 | 1,139 | 1,384 |
| 2006 | 1,147 | 1,346 | 1,372 | 1,350 | 1,271 | 1,140 | 1,278 | 1,249 | 1,008 | 1,395 | 1,071 | 1,267 |
| 2007 | 1,169 | 841 | 879 | 1,014 | 1,187 | 1,202 | 1,221 | 1,251 | 1,154 | 1,236 | 1,147 | 968 |
| 2008 | 1,123 | 1,170 | 1,202 | 1,097 | 1,158 | 1,260 | 1,133 | 1,256 | 1,217 | 1,223 | 1,058 | 961 |
| 2009 | 1,052 | 853 | 1,027 | 949 | 1,375 | 1,213 | 1,492 | 1,428 | 1,168 | 1,145 | 1,172 | 1,209 |
| 2010 | 1,085 | 1,051 | 1,359 | 1,277 | 1,298 | 1,125 | 1,248 | 1,332 | 1,309 | 1,218 | 1,120 | 1,189 |
| 2011 | 1,076 | 964 | 1,439 | 1,315 | 1,524 | 1,344 | 1,282 | 1,378 | 1,114 | 1,165 | 1,231 | 1,209 |
| 2012 | 1,189 | 1,076 | 1,507 | 1,225 | 1,489 | 1,282 | 1,411 | 1,420 | 1,272 | 1,375 | 1,249 | 1,157 |
| 2013 | 1,196 | 876 | 1,281 | 1,237 | 1,291 | 1,194 | 1,293 | 1,445 | 1,253 | 1,164 | 1,151 | 1,077 |
| 2014 | 1,063 | 908 | 1,182 | 1,338 | 1,379 | 1,225 | 1,252 | 1,430 | 1,321 | 1,329 | 1,247 | 1,326 |
| 2015 | 1,265 | 1,030 | 1,189 | 1,432 | 1,606 | 1,377 | 1,432 | 1,510 | 1,256 | 1,203 | 1,224 | 1,205 |
| 2016 | 1,434 | 1,233 | 1,325 | 1,353 | 1,402 | 1,458 | 1,657 | 1,508 | 1,361 | 1,356 | 1,300 | 1,281 |
| 2017 | 1,253 | 1,140 | 1,693 | 1,465 | 1,471 | 1,394 | 1,551 | 1,376 | 1,467 | 1,320 | 1,242 | 1,563 |
| 2018 | 1,468 | 1,207 | 1,308 | 1,540 | 1,643 | 1,550 | 1,538 | 1,700 | 1,400 | 1,501 | 1,205 | 1,404 |
| 2019 | 1,414 | 1,369 | 1,373 | 1,573 | 1,494 | 1,413 | 1,608 | 1,625 | 1,551 | 1,401 | 1,465 | 1,513 |
| 2020 | 937 | 1,016 | 1,380 | 533 | 552 | 885 | 1,381 | 1,121 | 1,108 | 1,065 | 1,161 | 853 |
| 2021 | 1,235 | 682 | 1,209 | 1,510 | 1,384 | 1,221 | 1,441 | 1,507 | 1,375 | 1,634 | 1,366 | 1,522 |
| 2022 | 1,318 | 1,296 | 1,460 | 1,408 | 1,620 | 1,522 | 1,441 | 1,531 | 1,352 | 1,492 | 1,558 | 1,263 |
| 2023 | 1,573 | 1,269 | 1,479 | 1,228 | 1,391 | 1,495 | 1,580 | 1,498 | 1,507 | 1,377 | 1,167 | 1,435 |
| 2024 | 1,539 | 1,301 | 1,700 | 1,632 | ||||||||
| - = No Data Reported; -- = Not Applicable; NA = Not Available; W = Withheld to avoid disclosure of individual company data. |
| Release Date: 6/28/2024 |
| Next Release Date: 7/31/2024 |