|
Download Data (XLS File) |
|
||||||||
|
||||||||
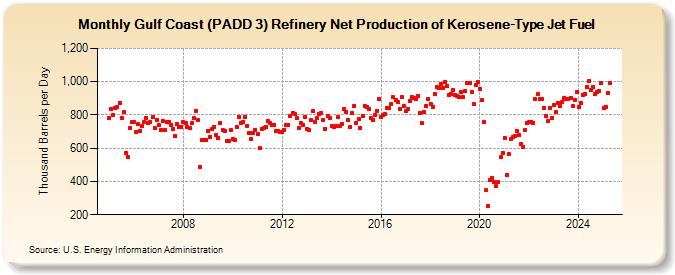
| Gulf Coast (PADD 3) Refinery Net Production of Kerosene-Type Jet Fuel (Thousand Barrels per Day) | ||||||||
| Year | Jan | Feb | Mar | Apr | May | Jun | Jul | Aug | Sep | Oct | Nov | Dec |
|---|---|---|---|---|---|---|---|---|---|---|---|---|
| 2005 | 782 | 834 | 800 | 843 | 850 | 873 | 784 | 816 | 573 | 548 | 720 | 757 |
| 2006 | 756 | 698 | 743 | 706 | 731 | 757 | 781 | 751 | 760 | 785 | 722 | 771 |
| 2007 | 739 | 708 | 765 | 712 | 759 | 760 | 742 | 714 | 673 | 743 | 729 | 727 |
| 2008 | 757 | 751 | 729 | 721 | 751 | 779 | 822 | 771 | 485 | 650 | 650 | 649 |
| 2009 | 704 | 669 | 713 | 730 | 678 | 662 | 754 | 712 | 702 | 642 | 642 | 707 |
| 2010 | 653 | 651 | 727 | 789 | 753 | 758 | 788 | 735 | 694 | 653 | 693 | 710 |
| 2011 | 685 | 599 | 715 | 719 | 729 | 762 | 752 | 740 | 742 | 702 | 704 | 699 |
| 2012 | 700 | 708 | 737 | 742 | 796 | 814 | 807 | 780 | 724 | 751 | 738 | 790 |
| 2013 | 716 | 709 | 771 | 825 | 757 | 781 | 804 | 812 | 771 | 718 | 793 | 783 |
| 2014 | 736 | 728 | 735 | 788 | 734 | 747 | 834 | 819 | 768 | 730 | 809 | 854 |
| 2015 | 751 | 774 | 724 | 795 | 856 | 849 | 836 | 780 | 767 | 799 | 824 | 897 |
| 2016 | 790 | 797 | 806 | 844 | 839 | 863 | 905 | 887 | 880 | 838 | 905 | 856 |
| 2017 | 825 | 833 | 884 | 909 | 903 | 893 | 916 | 813 | 749 | 819 | 856 | 898 |
| 2018 | 867 | 849 | 926 | 968 | 960 | 986 | 960 | 998 | 973 | 922 | 925 | 947 |
| 2019 | 920 | 914 | 905 | 935 | 905 | 942 | 989 | 991 | 940 | 865 | 977 | 999 |
| 2020 | 958 | 888 | 755 | 346 | 252 | 406 | 423 | 398 | 371 | 396 | 545 | 573 |
| 2021 | 663 | 440 | 564 | 653 | 666 | 671 | 701 | 678 | 628 | 609 | 710 | 754 |
| 2022 | 756 | 760 | 754 | 893 | 924 | 897 | 896 | 842 | 795 | 761 | 844 | 782 |
| 2023 | 859 | 815 | 872 | 856 | 880 | 904 | 898 | 898 | 903 | 854 | 890 | 936 |
| 2024 | 850 | |||||||||||
| - = No Data Reported; -- = Not Applicable; NA = Not Available; W = Withheld to avoid disclosure of individual company data. |
| Release Date: 3/29/2024 |
| Next Release Date: 4/30/2024 |