|
Download Data (XLS File) |
|
||||||||
|
||||||||
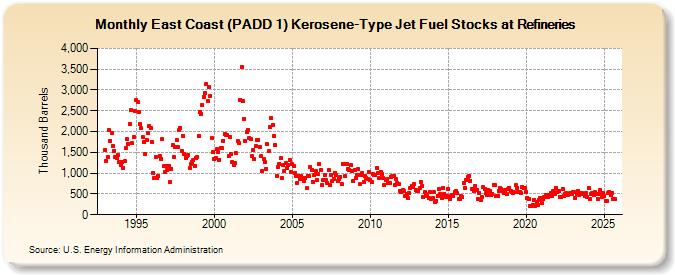
| East Coast (PADD 1) Kerosene-Type Jet Fuel Stocks at Refineries (Thousand Barrels) | ||||||||
| Year | Jan | Feb | Mar | Apr | May | Jun | Jul | Aug | Sep | Oct | Nov | Dec |
|---|---|---|---|---|---|---|---|---|---|---|---|---|
| 1993 | 1,559 | 1,285 | 1,388 | 2,044 | 1,784 | 1,966 | 1,656 | 1,533 | 1,386 | 1,360 | 1,425 | 1,258 |
| 1994 | 1,198 | 1,266 | 1,128 | 1,284 | 1,603 | 1,814 | 1,703 | 2,177 | 2,520 | 1,716 | 1,877 | 2,491 |
| 1995 | 2,756 | 2,718 | 2,473 | 2,172 | 2,075 | 1,865 | 1,741 | 1,455 | 1,804 | 1,957 | 2,125 | 2,078 |
| 1996 | 1,743 | 1,013 | 879 | 1,391 | 886 | 940 | 1,418 | 1,348 | 1,819 | 1,164 | 1,039 | 1,173 |
| 1997 | 1,077 | 1,181 | 792 | 1,110 | 1,675 | 1,386 | 1,638 | 1,798 | 1,622 | 2,036 | 2,088 | 1,542 |
| 1998 | 1,894 | 1,471 | 1,365 | 1,406 | 1,431 | 1,119 | 1,216 | 1,265 | 1,306 | 1,181 | 1,374 | 1,376 |
| 1999 | 1,902 | 2,464 | 2,426 | 2,639 | 2,834 | 2,923 | 3,149 | 2,736 | 3,073 | 2,845 | 1,835 | 1,498 |
| 2000 | 1,336 | 1,357 | 1,580 | 1,506 | 1,324 | 1,611 | 1,605 | 1,779 | 1,936 | 1,917 | 1,919 | 1,413 |
| 2001 | 1,881 | 1,466 | 1,274 | 1,206 | 1,250 | 1,476 | 1,768 | 1,723 | 2,769 | 3,556 | 2,725 | 2,310 |
| 2002 | 1,762 | 2,000 | 2,035 | 1,849 | 1,830 | 1,415 | 1,552 | 1,328 | 1,647 | 1,797 | 1,804 | 1,625 |
| 2003 | 1,401 | 1,041 | 1,334 | 1,257 | 1,105 | 1,694 | 1,523 | 2,100 | 2,327 | 2,167 | 1,895 | 1,678 |
| 2004 | 941 | 1,155 | 1,227 | 1,362 | 884 | 1,196 | 1,051 | 1,237 | 1,128 | 1,184 | 1,316 | 1,039 |
| 2005 | 1,210 | 1,180 | 995 | 929 | 766 | 936 | 861 | 932 | 885 | 807 | 872 | 635 |
| 2006 | 932 | 927 | 1,159 | 1,078 | 793 | 961 | 1,040 | 833 | 978 | 1,219 | 1,081 | 718 |
| 2007 | 823 | 955 | 834 | 772 | 1,073 | 708 | 967 | 820 | 863 | 1,013 | 965 | 816 |
| 2008 | 859 | 917 | 727 | 1,225 | 1,222 | 929 | 1,215 | 1,107 | 1,077 | 1,189 | 1,059 | 807 |
| 2009 | 1,078 | 872 | 960 | 1,091 | 730 | 959 | 1,008 | 798 | 933 | 883 | 859 | 1,031 |
| 2010 | 838 | 786 | 971 | 948 | 957 | 1,133 | 998 | 888 | 1,030 | 991 | 892 | 711 |
| 2011 | 828 | 854 | 751 | 772 | 911 | 929 | 933 | 705 | 868 | 759 | 731 | 582 |
| 2012 | 547 | 586 | 564 | 455 | 491 | 393 | 518 | 647 | 696 | 677 | 737 | 588 |
| 2013 | 560 | 578 | 639 | 784 | 695 | 435 | 541 | 489 | 453 | 397 | 541 | 387 |
| 2014 | 396 | 544 | 305 | 341 | 461 | 609 | 499 | 412 | 652 | 508 | 438 | 455 |
| 2015 | 628 | 378 | 443 | 484 | 460 | 545 | 571 | 511 | 374 | 388 | 440 | 425 |
| 2016 | 764 | 638 | 846 | 896 | 940 | 822 | 612 | 630 | 569 | 698 | 603 | 376 |
| 2017 | 521 | 358 | 420 | 664 | 625 | 511 | 472 | 600 | 563 | 479 | 506 | 718 |
| 2018 | 704 | 444 | 447 | 576 | 637 | 627 | 581 | 520 | 587 | 493 | 615 | 653 |
| 2019 | 576 | 558 | 522 | 540 | 708 | 646 | 545 | 552 | 518 | 656 | 635 | 650 |
| 2020 | 550 | 412 | 368 | 209 | 203 | 242 | 364 | 219 | 295 | 229 | 365 | 405 |
| 2021 | 274 | 371 | 424 | 469 | 476 | 423 | 477 | 530 | 448 | 562 | 506 | 644 |
| 2022 | 546 | 574 | 421 | 428 | 625 | 462 | 498 | 523 | 478 | 509 | 531 | 508 |
| 2023 | 544 | 537 | 400 | 498 | 575 | 480 | 530 | 511 | 496 | 448 | 531 | 414 |
| 2024 | 653 | 369 | 494 | 514 | ||||||||
| - = No Data Reported; -- = Not Applicable; NA = Not Available; W = Withheld to avoid disclosure of individual company data. |
| Release Date: 6/28/2024 |
| Next Release Date: 7/31/2024 |