|
Download Data (XLS File) |
|
||||||||
|
||||||||
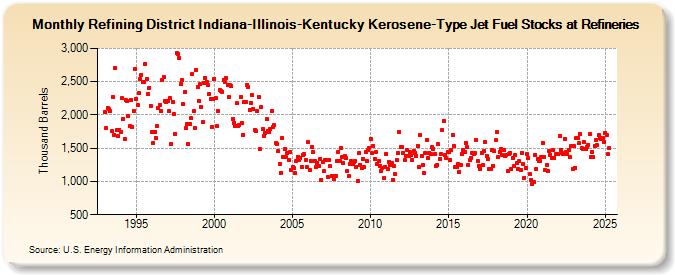
| Refining District Indiana-Illinois-Kentucky Kerosene-Type Jet Fuel Stocks at Refineries (Thousand Barrels) | ||||||||
| Year | Jan | Feb | Mar | Apr | May | Jun | Jul | Aug | Sep | Oct | Nov | Dec |
|---|---|---|---|---|---|---|---|---|---|---|---|---|
| 1993 | 2,044 | 1,802 | 2,107 | 2,091 | 2,052 | 1,754 | 2,274 | 1,705 | 2,705 | 1,767 | 1,681 | 1,779 |
| 1994 | 1,749 | 2,249 | 1,945 | 1,644 | 2,223 | 2,205 | 1,979 | 1,830 | 2,217 | 1,820 | 2,066 | 2,689 |
| 1995 | 2,244 | 2,146 | 2,333 | 2,541 | 2,605 | 2,497 | 2,493 | 2,766 | 2,538 | 2,318 | 2,412 | 2,139 |
| 1996 | 1,742 | 1,575 | 1,741 | 1,658 | 1,828 | 2,106 | 2,153 | 2,061 | 2,526 | 2,569 | 2,202 | 2,191 |
| 1997 | 2,216 | 2,054 | 2,250 | 1,565 | 2,199 | 2,009 | 1,718 | 2,925 | 2,918 | 2,858 | 2,460 | 2,528 |
| 1998 | 2,157 | 2,341 | 1,807 | 1,869 | 1,568 | 1,870 | 1,948 | 2,617 | 2,052 | 1,801 | 2,673 | 2,413 |
| 1999 | 2,208 | 2,458 | 2,115 | 1,889 | 2,487 | 2,557 | 2,497 | 2,443 | 2,321 | 2,236 | 1,811 | 2,244 |
| 2000 | 2,544 | 2,258 | 1,828 | 2,054 | 2,373 | 2,365 | 2,352 | 2,532 | 2,499 | 2,558 | 2,456 | 2,269 |
| 2001 | 2,443 | 2,432 | 1,946 | 1,876 | 1,839 | 2,173 | 1,830 | 1,849 | 2,275 | 1,881 | 1,704 | 2,190 |
| 2002 | 2,199 | 2,457 | 2,425 | 2,074 | 2,184 | 2,294 | 2,082 | 1,780 | 1,753 | 2,060 | 2,272 | 1,489 |
| 2003 | 2,112 | 1,787 | 1,677 | 1,735 | 1,937 | 1,755 | 1,741 | 1,787 | 2,052 | 1,813 | 1,844 | 1,571 |
| 2004 | 1,569 | 1,453 | 1,269 | 1,132 | 1,659 | 1,360 | 1,482 | 1,375 | 1,428 | 1,319 | 1,445 | 1,169 |
| 2005 | 1,213 | 1,196 | 1,120 | 1,309 | 1,375 | 1,319 | 1,349 | 1,219 | 1,391 | 1,413 | 1,323 | 1,221 |
| 2006 | 1,586 | 1,169 | 1,309 | 1,520 | 1,442 | 1,312 | 1,216 | 1,283 | 1,234 | 1,330 | 1,029 | 1,298 |
| 2007 | 1,152 | 1,315 | 1,323 | 1,072 | 1,319 | 1,225 | 1,087 | 1,084 | 1,038 | 1,089 | 1,311 | 1,448 |
| 2008 | 1,307 | 1,500 | 1,362 | 1,277 | 1,390 | 1,351 | 1,157 | 1,077 | 1,261 | 1,303 | 1,262 | 1,288 |
| 2009 | 1,302 | 1,224 | 1,004 | 1,426 | 1,246 | 1,208 | 1,344 | 1,212 | 1,440 | 1,313 | 1,476 | 1,504 |
| 2010 | 1,638 | 1,421 | 1,533 | 1,341 | 1,437 | 1,266 | 1,305 | 1,237 | 1,157 | 1,208 | 1,050 | 1,216 |
| 2011 | 1,419 | 1,185 | 1,299 | 1,250 | 1,281 | 1,027 | 1,226 | 1,108 | 1,320 | 1,434 | 1,749 | 1,516 |
| 2012 | 1,517 | 1,429 | 1,316 | 1,388 | 1,466 | 1,388 | 1,438 | 1,394 | 1,327 | 1,454 | 1,428 | 1,384 |
| 2013 | 1,540 | 1,219 | 1,700 | 1,380 | 1,244 | 1,129 | 1,424 | 1,628 | 1,357 | 1,428 | 1,408 | 1,514 |
| 2014 | 1,495 | 1,416 | 1,239 | 1,248 | 1,559 | 1,339 | 1,411 | 1,770 | 1,913 | 1,396 | 1,347 | 1,441 |
| 2015 | 1,437 | 1,326 | 1,469 | 1,696 | 1,536 | 1,221 | 1,223 | 1,268 | 1,141 | 1,244 | 1,417 | 1,472 |
| 2016 | 1,442 | 1,578 | 1,514 | 1,248 | 1,326 | 1,359 | 1,426 | 1,412 | 1,423 | 1,623 | 1,307 | 1,237 |
| 2017 | 1,192 | 1,433 | 1,245 | 1,459 | 1,586 | 1,381 | 1,339 | 1,192 | 1,193 | 1,468 | 1,238 | 1,457 |
| 2018 | 1,618 | 1,740 | 1,366 | 1,444 | 1,493 | 1,392 | 1,466 | 1,381 | 1,392 | 1,151 | 1,406 | 1,429 |
| 2019 | 1,182 | 1,356 | 1,227 | 1,405 | 1,273 | 1,188 | 1,303 | 1,170 | 1,434 | 1,257 | 1,059 | 1,203 |
| 2020 | 1,410 | 1,350 | 1,106 | 1,024 | 966 | 986 | 1,395 | 1,185 | 1,340 | 1,307 | 1,305 | 1,363 |
| 2021 | 1,585 | 1,364 | 1,178 | 1,251 | 1,162 | 1,460 | 1,398 | 1,349 | 1,466 | 1,359 | 1,407 | 1,418 |
| 2022 | 1,410 | 1,676 | 1,480 | 1,421 | 1,408 | 1,645 | 1,438 | 1,409 | 1,467 | 1,361 | 1,540 | 1,190 |
| 2023 | 1,529 | 1,208 | 1,657 | 1,659 | 1,574 | 1,718 | 1,499 | 1,485 | 1,590 | 1,489 | 1,515 | 1,548 |
| 2024 | 1,712 | |||||||||||
| - = No Data Reported; -- = Not Applicable; NA = Not Available; W = Withheld to avoid disclosure of individual company data. |
| Release Date: 3/29/2024 |
| Next Release Date: 4/30/2024 |