|
Download Data (XLS File) |
|
||||||||
|
||||||||
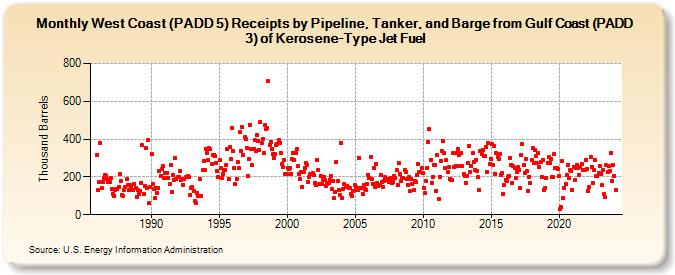
| West Coast (PADD 5) Receipts by Pipeline, Tanker, and Barge from Gulf Coast (PADD 3) of Kerosene-Type Jet Fuel (Thousand Barrels) | ||||||||
| Year | Jan | Feb | Mar | Apr | May | Jun | Jul | Aug | Sep | Oct | Nov | Dec |
|---|---|---|---|---|---|---|---|---|---|---|---|---|
| 1986 | 316 | 130 | 175 | 382 | 139 | 174 | 196 | 211 | 206 | 189 | 173 | 175 |
| 1987 | 193 | 137 | 110 | 101 | 133 | 137 | 136 | 149 | 216 | 178 | 103 | 101 |
| 1988 | 131 | 144 | 189 | 157 | 129 | 156 | 153 | 132 | 130 | 163 | 139 | 96 |
| 1989 | 129 | 110 | 124 | 168 | 368 | 110 | 151 | 355 | 141 | 396 | 62 | 145 |
| 1990 | 321 | 165 | 137 | 89 | 140 | 116 | 141 | 231 | 205 | 242 | 256 | 196 |
| 1991 | 221 | 195 | 221 | 194 | 161 | 261 | 120 | 211 | 184 | 301 | 187 | 199 |
| 1992 | 199 | 232 | 186 | 187 | 159 | 189 | 197 | 201 | 207 | 201 | 106 | 140 |
| 1993 | 146 | 128 | 74 | 64 | 116 | 97 | 97 | 190 | 99 | 236 | 283 | 234 |
| 1994 | 349 | 324 | 292 | 351 | 346 | 266 | 315 | 316 | 308 | 272 | 231 | 198 |
| 1995 | 288 | 245 | 195 | 216 | 235 | 238 | 263 | 347 | 188 | 359 | 294 | 459 |
| 1996 | 337 | 246 | 160 | 189 | 277 | 245 | 436 | 335 | 462 | 317 | 409 | 399 |
| 1997 | 353 | 205 | 293 | 477 | 348 | 264 | 345 | 393 | 339 | 421 | 390 | 344 |
| 1998 | 489 | 377 | 399 | 326 | 472 | 451 | 457 | 705 | 370 | 386 | 346 | 320 |
| 1999 | 302 | 319 | 367 | 372 | 393 | 381 | 326 | 269 | 251 | 291 | 218 | 215 |
| 2000 | 245 | 241 | 247 | 217 | 294 | 329 | 291 | 325 | 346 | 257 | 217 | 189 |
| 2001 | 226 | 147 | 225 | 246 | 272 | 265 | 171 | 199 | 214 | 215 | 219 | 210 |
| 2002 | 170 | 156 | 287 | 237 | 165 | 206 | 161 | 186 | 200 | 185 | 153 | 164 |
| 2003 | 170 | 185 | 203 | 135 | 179 | 86 | 119 | 281 | 176 | 133 | 106 | 382 |
| 2004 | 91 | 137 | 160 | 146 | 150 | 145 | 142 | 140 | 109 | 97 | 127 | 157 |
| 2005 | 148 | 132 | 130 | 299 | 142 | 142 | 112 | 158 | 137 | 133 | 161 | 209 |
| 2006 | 196 | 303 | 187 | 165 | 246 | 146 | 269 | 168 | 152 | 155 | 208 | 173 |
| 2007 | 147 | 178 | 199 | 181 | 187 | 174 | 188 | 194 | 169 | 175 | 204 | 196 |
| 2008 | 236 | 158 | 274 | 213 | 176 | 194 | 193 | 239 | 224 | 188 | 159 | 198 |
| 2009 | 123 | 188 | 165 | 131 | 180 | 174 | 208 | 268 | 224 | 225 | 247 | 220 |
| 2010 | 143 | 113 | 179 | 248 | 385 | 454 | 292 | 167 | 201 | 265 | 264 | 123 |
| 2011 | 314 | 83 | 201 | 286 | 338 | 390 | 325 | 245 | 289 | 224 | 252 | 191 |
| 2012 | 186 | 181 | 329 | 251 | 260 | 325 | 348 | 314 | 256 | 326 | 257 | 215 |
| 2013 | 204 | 168 | 206 | 275 | 365 | 226 | 258 | 325 | 281 | 236 | 290 | 231 |
| 2014 | 197 | 130 | 339 | 319 | 344 | 309 | 309 | 359 | 227 | 379 | 267 | 297 |
| 2015 | 373 | 264 | 365 | 218 | 325 | 306 | 297 | 321 | 208 | 219 | 110 | 155 |
| 2016 | 185 | 177 | 200 | 206 | 302 | 265 | 168 | 256 | 246 | 194 | 227 | 250 |
| 2017 | 237 | 143 | 317 | 373 | 263 | 221 | 296 | 232 | 125 | 202 | 170 | 287 |
| 2018 | 352 | 273 | 341 | 309 | 272 | 325 | 254 | 277 | 202 | 289 | 131 | 143 |
| 2019 | 192 | 275 | 305 | 274 | 295 | 197 | 199 | 320 | 247 | 247 | 242 | 204 |
| 2020 | 30 | 41 | 285 | 87 | 139 | 165 | 211 | 264 | 192 | 234 | 230 | 131 |
| 2021 | 255 | 182 | 245 | 265 | 245 | 209 | 252 | 266 | 237 | 239 | 239 | 291 |
| 2022 | 244 | 123 | 146 | 303 | 255 | 169 | 235 | 288 | 207 | 203 | 221 | 260 |
| 2023 | 217 | 156 | 235 | 110 | 92 | 261 | 227 | 259 | 229 | 329 | 178 | 265 |
| 2024 | 205 | |||||||||||
| - = No Data Reported; -- = Not Applicable; NA = Not Available; W = Withheld to avoid disclosure of individual company data. |
| Release Date: 3/29/2024 |
| Next Release Date: 4/30/2024 |