|
Download Data (XLS File) |
|
||||||||
|
||||||||
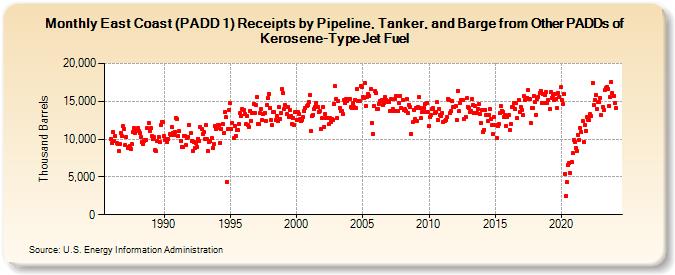
| East Coast (PADD 1) Receipts by Pipeline, Tanker, and Barge from Other PADDs of Kerosene-Type Jet Fuel (Thousand Barrels) | ||||||||
| Year | Jan | Feb | Mar | Apr | May | Jun | Jul | Aug | Sep | Oct | Nov | Dec |
|---|---|---|---|---|---|---|---|---|---|---|---|---|
| 1986 | 10,059 | 9,448 | 10,918 | 9,768 | 10,415 | 9,501 | 9,347 | 8,402 | 9,406 | 10,805 | 10,351 | 11,760 |
| 1987 | 11,368 | 9,221 | 10,294 | 8,799 | 8,958 | 9,106 | 8,743 | 9,287 | 10,914 | 11,446 | 10,863 | 11,293 |
| 1988 | 11,405 | 11,081 | 10,867 | 10,281 | 9,637 | 9,374 | 9,709 | 9,854 | 9,871 | 11,433 | 12,185 | 11,055 |
| 1989 | 11,433 | 10,447 | 9,952 | 10,252 | 8,530 | 8,363 | 9,789 | 10,276 | 9,579 | 11,811 | 12,317 | 12,224 |
| 1990 | 10,380 | 9,816 | 9,980 | 9,594 | 9,996 | 10,618 | 10,490 | 11,537 | 10,770 | 10,485 | 10,889 | 12,856 |
| 1991 | 12,598 | 10,380 | 11,030 | 9,808 | 8,919 | 8,985 | 10,368 | 10,401 | 9,183 | 10,164 | 10,252 | 11,916 |
| 1992 | 10,803 | 9,770 | 8,463 | 9,619 | 8,781 | 9,485 | 8,969 | 10,049 | 9,741 | 11,598 | 11,286 | 10,713 |
| 1993 | 10,991 | 9,949 | 11,849 | 9,948 | 8,404 | 9,668 | 9,755 | 10,105 | 8,829 | 9,387 | 11,719 | 11,390 |
| 1994 | 11,463 | 11,907 | 11,873 | 9,545 | 11,362 | 12,033 | 10,781 | 13,606 | 12,883 | 4,338 | 11,354 | 13,881 |
| 1995 | 14,736 | 11,354 | 12,107 | 10,106 | 11,675 | 10,459 | 11,171 | 11,232 | 12,000 | 13,395 | 13,119 | 14,002 |
| 1996 | 13,872 | 13,362 | 11,962 | 13,073 | 11,844 | 11,610 | 13,765 | 12,400 | 13,499 | 14,613 | 13,490 | 14,515 |
| 1997 | 15,600 | 12,036 | 11,943 | 13,428 | 13,919 | 12,535 | 13,300 | 13,504 | 12,432 | 14,542 | 15,402 | 15,995 |
| 1998 | 14,120 | 12,526 | 11,897 | 13,580 | 13,603 | 12,570 | 13,091 | 12,458 | 14,192 | 12,714 | 13,459 | 16,624 |
| 1999 | 16,055 | 13,958 | 14,450 | 13,260 | 14,300 | 12,884 | 13,841 | 13,089 | 12,060 | 12,808 | 11,889 | 13,535 |
| 2000 | 12,560 | 13,583 | 13,370 | 12,642 | 12,404 | 12,561 | 12,985 | 13,666 | 14,113 | 14,352 | 14,563 | 14,860 |
| 2001 | 15,841 | 11,119 | 13,017 | 13,240 | 13,963 | 14,233 | 14,830 | 14,228 | 13,600 | 13,773 | 11,293 | 12,747 |
| 2002 | 14,290 | 11,652 | 13,313 | 12,795 | 12,852 | 11,937 | 12,729 | 12,236 | 12,660 | 12,528 | 14,705 | 16,995 |
| 2003 | 15,312 | 12,797 | 15,046 | 14,148 | 13,759 | 13,699 | 13,302 | 15,188 | 14,782 | 15,257 | 15,072 | 15,275 |
| 2004 | 15,272 | 14,197 | 14,132 | 14,720 | 14,208 | 15,235 | 14,093 | 16,596 | 15,006 | 15,025 | 17,071 | 16,954 |
| 2005 | 15,592 | 15,501 | 17,388 | 14,319 | 15,619 | 15,952 | 15,756 | 16,585 | 12,180 | 10,713 | 14,388 | 16,309 |
| 2006 | 16,147 | 13,927 | 13,968 | 14,684 | 15,019 | 15,138 | 14,500 | 14,739 | 15,542 | 15,194 | 15,008 | 14,871 |
| 2007 | 14,949 | 13,697 | 15,282 | 13,952 | 13,738 | 15,279 | 15,722 | 13,750 | 13,767 | 14,766 | 15,688 | 14,140 |
| 2008 | 15,187 | 13,881 | 13,939 | 13,668 | 15,355 | 13,387 | 14,560 | 14,260 | 10,719 | 12,216 | 13,906 | 12,605 |
| 2009 | 14,135 | 12,357 | 14,306 | 15,538 | 14,050 | 12,753 | 13,576 | 14,142 | 14,630 | 13,596 | 14,787 | 13,521 |
| 2010 | 11,701 | 12,900 | 13,180 | 13,956 | 14,054 | 13,478 | 13,637 | 14,851 | 12,580 | 13,981 | 13,198 | 13,031 |
| 2011 | 13,440 | 12,202 | 12,439 | 12,520 | 12,908 | 15,334 | 15,147 | 13,415 | 13,754 | 14,980 | 14,255 | 14,212 |
| 2012 | 14,366 | 12,587 | 16,396 | 13,675 | 14,822 | 15,223 | 15,216 | 15,164 | 12,691 | 12,925 | 15,372 | 14,240 |
| 2013 | 14,088 | 13,646 | 13,686 | 15,310 | 14,531 | 13,513 | 14,390 | 13,480 | 13,951 | 14,584 | 13,373 | 12,156 |
| 2014 | 13,860 | 10,984 | 11,262 | 13,867 | 13,159 | 12,335 | 13,193 | 13,977 | 12,638 | 11,843 | 10,670 | 12,929 |
| 2015 | 11,834 | 10,209 | 11,764 | 11,938 | 13,459 | 14,400 | 13,776 | 13,582 | 12,970 | 13,135 | 11,703 | 12,965 |
| 2016 | 13,175 | 11,168 | 12,001 | 14,276 | 14,195 | 14,791 | 13,960 | 14,747 | 12,779 | 15,232 | 13,552 | 14,276 |
| 2017 | 13,896 | 13,208 | 15,673 | 15,112 | 15,330 | 15,482 | 16,480 | 15,255 | 12,172 | 14,053 | 14,107 | 15,709 |
| 2018 | 14,944 | 13,244 | 15,328 | 15,627 | 16,064 | 16,419 | 14,827 | 16,014 | 14,714 | 15,803 | 16,228 | 14,747 |
| 2019 | 15,152 | 13,917 | 16,225 | 15,442 | 15,835 | 15,107 | 16,006 | 15,341 | 14,105 | 16,142 | 15,605 | 16,849 |
| 2020 | 15,136 | 14,595 | 15,954 | 5,392 | 2,509 | 4,294 | 6,522 | 6,848 | 5,541 | 6,953 | 8,157 | 9,850 |
| 2021 | 9,569 | 8,872 | 8,374 | 10,567 | 9,919 | 11,531 | 10,913 | 12,437 | 9,656 | 11,881 | 11,137 | 12,913 |
| 2022 | 12,462 | 12,487 | 13,277 | 13,100 | 17,424 | 14,471 | 15,216 | 15,800 | 14,003 | 14,921 | 14,876 | 15,495 |
| 2023 | 13,161 | 14,259 | 13,798 | 16,428 | 16,814 | 16,903 | 16,666 | 14,365 | 15,507 | 17,615 | 16,053 | 15,747 |
| 2024 | 14,781 | |||||||||||
| - = No Data Reported; -- = Not Applicable; NA = Not Available; W = Withheld to avoid disclosure of individual company data. |
| Release Date: 3/29/2024 |
| Next Release Date: 4/30/2024 |