|
Download Data (XLS File) |
|
||||||||
|
||||||||
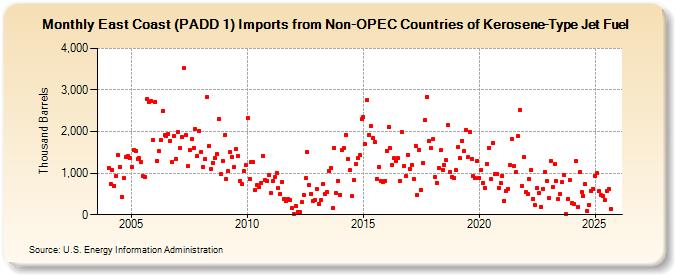
| East Coast (PADD 1) Imports from Non-OPEC Countries of Kerosene-Type Jet Fuel (Thousand Barrels) | ||||||||
| Year | Jan | Feb | Mar | Apr | May | Jun | Jul | Aug | Sep | Oct | Nov | Dec |
|---|---|---|---|---|---|---|---|---|---|---|---|---|
| 2004 | 1,118 | 740 | 1,072 | 701 | 939 | 1,434 | 1,142 | 436 | 874 | 1,382 | 1,413 | 1,370 |
| 2005 | 1,148 | 1,547 | 1,528 | 1,343 | 1,357 | 1,267 | 926 | 910 | 2,791 | 2,709 | 2,729 | 1,808 |
| 2006 | 2,717 | 1,298 | 1,524 | 1,790 | 2,499 | 1,907 | 1,883 | 1,946 | 1,783 | 1,273 | 1,894 | 1,338 |
| 2007 | 1,987 | 1,596 | 1,880 | 3,518 | 1,911 | 1,164 | 1,566 | 1,810 | 1,613 | 2,063 | 1,406 | 2,015 |
| 2008 | 1,514 | 1,151 | 1,342 | 2,828 | 1,652 | 1,095 | 1,252 | 1,359 | 1,459 | 2,301 | 980 | 1,298 |
| 2009 | 1,917 | 861 | 1,043 | 1,509 | 1,398 | 1,137 | 1,570 | 1,422 | 819 | 735 | 1,041 | 1,188 |
| 2010 | 2,335 | 870 | 1,270 | 1,256 | 602 | 716 | 662 | 773 | 1,420 | 843 | 821 | 958 |
| 2011 | 528 | 802 | 905 | 1,008 | 644 | 510 | 793 | 389 | 327 | 385 | 348 | 155 |
| 2012 | 23 | 199 | 66 | 61 | 302 | 477 | 876 | 1,500 | 705 | 508 | 340 | 348 |
| 2013 | 616 | 266 | 345 | 750 | 491 | 538 | 1,059 | 1,120 | 152 | 1,612 | 518 | 812 |
| 2014 | 484 | 1,562 | 1,598 | 1,919 | 1,330 | 1,075 | 439 | 832 | 1,216 | 1,358 | 1,434 | 2,293 |
| 2015 | 2,354 | 1,692 | 2,762 | 1,911 | 2,123 | 1,846 | 1,746 | 860 | 1,153 | 802 | 787 | 814 |
| 2016 | 1,529 | 2,108 | 1,595 | 1,199 | 1,357 | 1,298 | 1,355 | 807 | 1,985 | 1,172 | 931 | 1,447 |
| 2017 | 1,099 | 1,199 | 867 | 1,663 | 481 | 1,565 | 596 | 1,244 | 2,267 | 2,832 | 1,769 | 1,602 |
| 2018 | 1,820 | 912 | 771 | 1,113 | 1,547 | 1,083 | 1,189 | 1,309 | 2,149 | 1,036 | 903 | 886 |
| 2019 | 1,081 | 1,617 | 1,356 | 1,782 | 1,526 | 2,042 | 1,379 | 1,998 | 1,329 | 936 | 871 | 1,293 |
| 2020 | 879 | 1,084 | 772 | 646 | 1,223 | 1,612 | 854 | 1,734 | 982 | 989 | 650 | 758 |
| 2021 | 942 | 330 | 561 | 617 | 1,192 | 1,823 | 1,175 | 1,027 | 1,889 | 2,527 | 701 | 1,385 |
| 2022 | 551 | 500 | 849 | 1,083 | 386 | 224 | 640 | 524 | 185 | 625 | 1,035 | 809 |
| 2023 | 393 | 1,299 | 662 | 1,219 | 811 | 374 | 493 | 784 | 960 | 10 | 367 | 824 |
| 2024 | 276 | 262 | 1,294 | 197 | 1,026 | 516 | 454 | 729 | 88 | 245 | 582 | 627 |
| 2025 | 938 | 992 | 559 | 472 | ||||||||
| - = No Data Reported; -- = Not Applicable; NA = Not Available; W = Withheld to avoid disclosure of individual company data. |
| Release Date: 6/30/2025 |
| Next Release Date: 7/31/2025 |