|
Download Data (XLS File) |
|
||||||||
|
||||||||
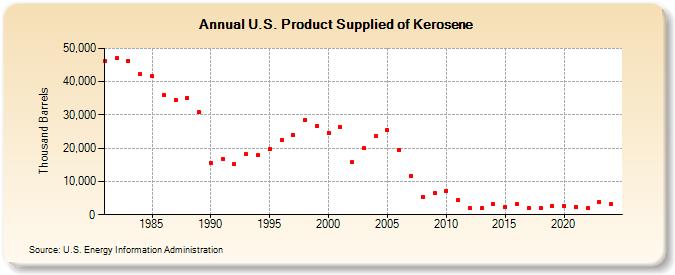
| U.S. Product Supplied of Kerosene (Thousand Barrels) | ||||||||
| Decade | Year-0 | Year-1 | Year-2 | Year-3 | Year-4 | Year-5 | Year-6 | Year-7 | Year-8 | Year-9 |
|---|---|---|---|---|---|---|---|---|---|---|
| 1980's | 46,306 | 46,963 | 46,352 | 42,185 | 41,567 | 35,862 | 34,513 | 35,199 | 30,753 | |
| 1990's | 15,524 | 16,898 | 15,153 | 18,114 | 17,865 | 19,725 | 22,595 | 24,046 | 28,490 | 26,622 |
| 2000's | 24,667 | 26,403 | 15,817 | 19,940 | 23,540 | 25,480 | 19,594 | 11,731 | 5,208 | 6,405 |
| 2010's | 7,274 | 4,468 | 1,931 | 1,897 | 3,284 | 2,331 | 3,173 | 1,890 | 1,976 | 2,472 |
| 2020's | 2,743 | 2,169 | 1,916 | 4,077 |
| - = No Data Reported; -- = Not Applicable; NA = Not Available; W = Withheld to avoid disclosure of individual company data. |
| Release Date: 3/29/2024 |
| Next Release Date: 8/30/2024 |