|
Download Data (XLS File) |
|
||||||||
|
||||||||
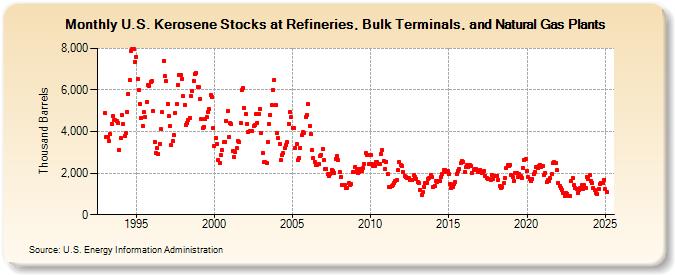
| U.S. Kerosene Stocks at Refineries, Bulk Terminals, and Natural Gas Plants (Thousand Barrels) | ||||||||
| Year | Jan | Feb | Mar | Apr | May | Jun | Jul | Aug | Sep | Oct | Nov | Dec |
|---|---|---|---|---|---|---|---|---|---|---|---|---|
| 1993 | 4,916 | 3,744 | 3,733 | 3,561 | 3,870 | 4,366 | 4,732 | 4,540 | 4,543 | 4,524 | 4,427 | 3,134 |
| 1994 | 3,680 | 4,803 | 4,343 | 3,781 | 3,913 | 4,964 | 5,830 | 6,474 | 7,879 | 7,977 | 7,991 | 7,366 |
| 1995 | 7,602 | 6,530 | 5,990 | 5,332 | 4,675 | 4,255 | 4,917 | 4,703 | 5,432 | 6,247 | 6,206 | 6,394 |
| 1996 | 6,436 | 4,969 | 3,504 | 2,973 | 3,208 | 2,909 | 3,406 | 4,105 | 4,923 | 7,412 | 6,664 | 6,412 |
| 1997 | 5,327 | 4,737 | 4,258 | 3,341 | 3,569 | 3,827 | 4,898 | 5,329 | 6,255 | 6,699 | 6,699 | 6,548 |
| 1998 | 5,704 | 5,292 | 4,323 | 4,420 | 4,534 | 4,670 | 5,708 | 5,958 | 6,445 | 6,754 | 6,839 | 6,151 |
| 1999 | 6,129 | 5,578 | 4,597 | 4,171 | 4,227 | 4,586 | 4,707 | 4,926 | 5,099 | 5,757 | 5,667 | 4,154 |
| 2000 | 3,299 | 3,686 | 3,380 | 2,611 | 2,476 | 2,865 | 3,089 | 3,482 | 3,504 | 4,514 | 4,981 | 3,733 |
| 2001 | 4,418 | 4,346 | 3,074 | 2,779 | 3,004 | 3,206 | 3,567 | 3,495 | 4,423 | 5,977 | 6,081 | 5,127 |
| 2002 | 4,862 | 4,385 | 3,995 | 4,020 | 4,018 | 4,023 | 4,245 | 4,296 | 4,854 | 4,425 | 4,851 | 5,101 |
| 2003 | 3,937 | 2,976 | 2,529 | 2,520 | 2,496 | 3,511 | 4,361 | 4,816 | 5,277 | 6,001 | 6,500 | 5,289 |
| 2004 | 3,909 | 3,678 | 3,423 | 2,628 | 2,869 | 2,963 | 3,187 | 3,362 | 3,485 | 4,364 | 4,924 | 4,684 |
| 2005 | 4,182 | 4,158 | 3,218 | 3,382 | 2,629 | 2,740 | 3,211 | 3,819 | 3,957 | 3,945 | 4,688 | 4,789 |
| 2006 | 5,317 | 4,273 | 3,878 | 3,109 | 2,726 | 2,558 | 2,373 | 2,401 | 2,457 | 2,826 | 2,882 | 3,182 |
| 2007 | 2,639 | 2,201 | 2,189 | 1,957 | 1,850 | 1,964 | 2,173 | 2,123 | 2,020 | 2,687 | 2,810 | 2,622 |
| 2008 | 2,071 | 1,814 | 1,449 | 1,449 | 1,424 | 1,288 | 1,299 | 1,505 | 1,451 | 1,478 | 2,036 | 2,040 |
| 2009 | 2,315 | 2,180 | 2,024 | 2,041 | 2,200 | 2,084 | 2,239 | 2,446 | 2,955 | 2,878 | 2,884 | 2,425 |
| 2010 | 2,878 | 2,442 | 2,362 | 2,363 | 2,539 | 2,517 | 2,452 | 2,451 | 2,909 | 3,101 | 2,603 | 2,197 |
| 2011 | 2,549 | 1,937 | 1,355 | 1,336 | 1,362 | 1,445 | 1,528 | 1,611 | 1,658 | 2,132 | 2,535 | 2,398 |
| 2012 | 2,325 | 2,041 | 1,865 | 1,828 | 1,782 | 1,757 | 1,649 | 1,662 | 1,683 | 1,892 | 1,835 | 1,720 |
| 2013 | 1,575 | 1,510 | 1,198 | 964 | 1,089 | 1,357 | 1,524 | 1,549 | 1,731 | 1,779 | 1,928 | 1,822 |
| 2014 | 1,330 | 1,402 | 1,618 | 1,561 | 1,600 | 1,601 | 1,798 | 1,950 | 2,157 | 2,141 | 2,039 | 2,092 |
| 2015 | 1,942 | 1,490 | 1,272 | 1,344 | 1,455 | 1,585 | 1,951 | 2,102 | 2,201 | 2,471 | 2,578 | 2,550 |
| 2016 | 2,048 | 2,273 | 2,373 | 2,281 | 2,376 | 2,366 | 2,028 | 2,162 | 2,204 | 2,177 | 2,054 | 2,065 |
| 2017 | 2,168 | 1,988 | 2,073 | 2,096 | 1,879 | 1,784 | 1,704 | 1,735 | 1,692 | 1,927 | 1,711 | 1,883 |
| 2018 | 1,848 | 1,880 | 1,684 | 1,396 | 1,283 | 1,325 | 1,509 | 1,781 | 2,235 | 2,371 | 2,343 | 2,408 |
| 2019 | 1,889 | 1,794 | 1,636 | 1,990 | 2,028 | 1,813 | 1,948 | 1,864 | 1,775 | 2,252 | 2,609 | 2,667 |
| 2020 | 2,109 | 1,796 | 1,694 | 1,635 | 1,726 | 1,936 | 2,066 | 2,299 | 2,231 | 2,347 | 2,408 | 2,306 |
| 2021 | 2,341 | 1,931 | 1,998 | 1,554 | 1,651 | 1,619 | 1,757 | 1,951 | 2,468 | 2,515 | 2,483 | 2,148 |
| 2022 | 1,544 | 1,402 | 1,281 | 1,201 | 1,044 | 912 | 1,051 | 1,012 | 897 | 895 | 1,624 | 1,789 |
| 2023 | 1,414 | 1,252 | 1,257 | 1,041 | 1,183 | 1,283 | 1,413 | 1,258 | 1,401 | 1,273 | 1,823 | 1,739 |
| 2024 | 1,906 | 1,620 | 1,545 | 1,276 | ||||||||
| - = No Data Reported; -- = Not Applicable; NA = Not Available; W = Withheld to avoid disclosure of individual company data. |
| Release Date: 6/28/2024 |
| Next Release Date: 7/31/2024 |