|
Download Data (XLS File) |
|
||||||||
|
||||||||
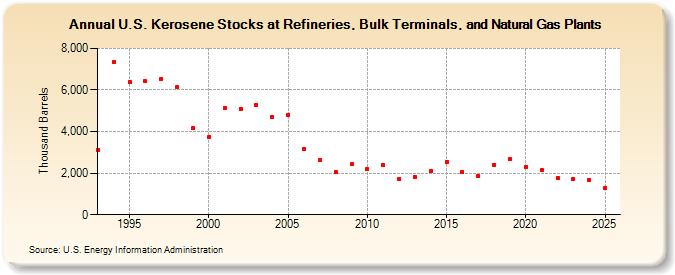
| U.S. Kerosene Stocks at Refineries, Bulk Terminals, and Natural Gas Plants (Thousand Barrels) | ||||||||
| Decade | Year-0 | Year-1 | Year-2 | Year-3 | Year-4 | Year-5 | Year-6 | Year-7 | Year-8 | Year-9 |
|---|---|---|---|---|---|---|---|---|---|---|
| 1990's | 3,134 | 7,366 | 6,394 | 6,412 | 6,548 | 6,151 | 4,154 | |||
| 2000's | 3,733 | 5,127 | 5,101 | 5,289 | 4,684 | 4,789 | 3,182 | 2,622 | 2,040 | 2,425 |
| 2010's | 2,197 | 2,398 | 1,720 | 1,822 | 2,092 | 2,550 | 2,065 | 1,883 | 2,408 | 2,667 |
| 2020's | 2,306 | 2,148 | 1,789 | 1,739 |
| - = No Data Reported; -- = Not Applicable; NA = Not Available; W = Withheld to avoid disclosure of individual company data. |
| Release Date: 3/29/2024 |
| Next Release Date: 8/30/2024 |