|
Download Data (XLS File) |
|
||||||||
|
||||||||
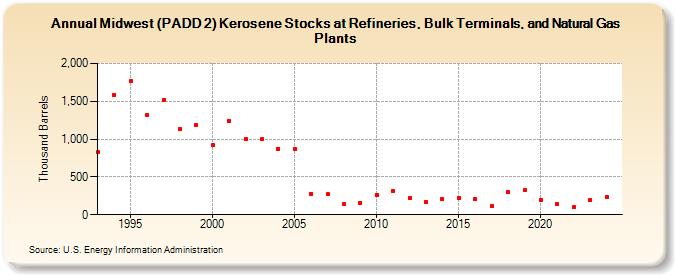
| Midwest (PADD 2) Kerosene Stocks at Refineries, Bulk Terminals, and Natural Gas Plants (Thousand Barrels) | ||||||||
| Decade | Year-0 | Year-1 | Year-2 | Year-3 | Year-4 | Year-5 | Year-6 | Year-7 | Year-8 | Year-9 |
|---|---|---|---|---|---|---|---|---|---|---|
| 1990's | 832 | 1,589 | 1,766 | 1,323 | 1,520 | 1,135 | 1,189 | |||
| 2000's | 921 | 1,241 | 1,004 | 996 | 873 | 868 | 275 | 269 | 140 | 161 |
| 2010's | 266 | 316 | 222 | 173 | 207 | 218 | 202 | 120 | 299 | 322 |
| 2020's | 198 | 137 | 98 | 200 |
| - = No Data Reported; -- = Not Applicable; NA = Not Available; W = Withheld to avoid disclosure of individual company data. |
| Release Date: 3/29/2024 |
| Next Release Date: 8/30/2024 |