|
Download Data (XLS File) |
|
||||||||
|
||||||||
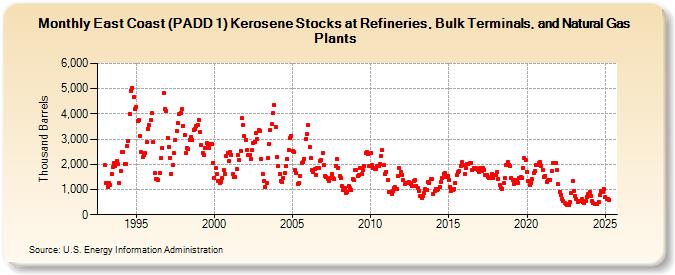
| East Coast (PADD 1) Kerosene Stocks at Refineries, Bulk Terminals, and Natural Gas Plants (Thousand Barrels) | ||||||||
| Year | Jan | Feb | Mar | Apr | May | Jun | Jul | Aug | Sep | Oct | Nov | Dec |
|---|---|---|---|---|---|---|---|---|---|---|---|---|
| 1993 | 1,964 | 1,263 | 1,119 | 1,251 | 1,184 | 1,627 | 1,874 | 2,068 | 1,942 | 2,121 | 2,000 | 1,265 |
| 1994 | 1,742 | 2,471 | 2,502 | 2,019 | 2,016 | 2,733 | 2,930 | 4,014 | 4,907 | 5,047 | 4,661 | 4,183 |
| 1995 | 4,284 | 3,706 | 3,757 | 3,130 | 2,469 | 2,273 | 2,366 | 2,435 | 2,872 | 3,410 | 3,561 | 3,748 |
| 1996 | 4,044 | 2,890 | 1,636 | 1,434 | 1,414 | 1,396 | 1,665 | 2,248 | 2,663 | 4,822 | 4,188 | 4,119 |
| 1997 | 3,059 | 2,695 | 2,260 | 1,630 | 1,986 | 2,432 | 2,980 | 3,302 | 3,628 | 3,982 | 4,050 | 4,193 |
| 1998 | 3,520 | 3,148 | 2,440 | 2,659 | 2,599 | 2,973 | 3,090 | 2,963 | 3,361 | 3,414 | 3,501 | 3,564 |
| 1999 | 3,760 | 3,270 | 2,755 | 2,450 | 2,354 | 2,639 | 2,842 | 2,790 | 2,653 | 2,810 | 2,824 | 2,065 |
| 2000 | 1,476 | 1,841 | 1,623 | 1,357 | 1,244 | 1,305 | 1,455 | 1,784 | 1,626 | 2,331 | 2,455 | 2,112 |
| 2001 | 2,477 | 2,376 | 1,614 | 1,479 | 1,490 | 1,808 | 2,365 | 2,151 | 2,542 | 3,832 | 3,563 | 3,107 |
| 2002 | 2,977 | 2,575 | 2,352 | 2,354 | 2,207 | 2,554 | 2,851 | 2,904 | 3,245 | 3,017 | 3,342 | 3,313 |
| 2003 | 2,197 | 1,633 | 1,338 | 1,095 | 1,240 | 2,267 | 2,798 | 3,378 | 3,589 | 4,026 | 4,353 | 3,482 |
| 2004 | 2,290 | 1,940 | 1,629 | 1,343 | 1,280 | 1,458 | 1,636 | 1,924 | 2,218 | 2,580 | 3,027 | 3,113 |
| 2005 | 2,517 | 2,486 | 1,773 | 1,645 | 1,235 | 1,242 | 1,535 | 2,045 | 2,072 | 2,221 | 2,996 | 3,184 |
| 2006 | 3,545 | 2,695 | 2,237 | 1,770 | 1,704 | 1,813 | 1,579 | 1,834 | 1,873 | 2,119 | 2,183 | 2,442 |
| 2007 | 1,969 | 1,553 | 1,501 | 1,434 | 1,337 | 1,452 | 1,631 | 1,457 | 1,413 | 1,927 | 2,213 | 1,865 |
| 2008 | 1,528 | 1,446 | 1,120 | 972 | 1,071 | 872 | 909 | 1,131 | 1,045 | 975 | 1,413 | 1,359 |
| 2009 | 1,756 | 1,787 | 1,524 | 1,561 | 1,853 | 1,605 | 1,777 | 1,923 | 2,445 | 2,493 | 2,416 | 1,916 |
| 2010 | 2,438 | 1,972 | 1,870 | 1,806 | 1,801 | 1,942 | 1,928 | 2,002 | 2,328 | 2,566 | 1,968 | 1,605 |
| 2011 | 1,708 | 1,368 | 920 | 902 | 826 | 926 | 1,072 | 1,085 | 1,001 | 1,547 | 1,842 | 1,678 |
| 2012 | 1,585 | 1,375 | 1,206 | 1,270 | 1,243 | 1,287 | 1,252 | 1,222 | 1,122 | 1,318 | 1,358 | 1,158 |
| 2013 | 1,058 | 951 | 735 | 682 | 733 | 858 | 1,017 | 992 | 1,311 | 1,270 | 1,413 | 1,408 |
| 2014 | 821 | 930 | 1,037 | 975 | 1,022 | 1,098 | 1,312 | 1,439 | 1,626 | 1,641 | 1,506 | 1,543 |
| 2015 | 1,393 | 1,117 | 936 | 999 | 1,036 | 1,254 | 1,580 | 1,693 | 1,740 | 1,940 | 2,073 | 1,962 |
| 2016 | 1,605 | 1,865 | 2,011 | 2,005 | 2,045 | 2,052 | 1,762 | 1,857 | 1,818 | 1,842 | 1,774 | 1,709 |
| 2017 | 1,851 | 1,735 | 1,842 | 1,789 | 1,589 | 1,574 | 1,505 | 1,439 | 1,471 | 1,617 | 1,443 | 1,561 |
| 2018 | 1,573 | 1,685 | 1,418 | 1,189 | 1,041 | 1,038 | 1,250 | 1,439 | 1,968 | 2,101 | 1,975 | 1,922 |
| 2019 | 1,474 | 1,378 | 1,238 | 1,359 | 1,364 | 1,251 | 1,448 | 1,484 | 1,475 | 1,862 | 2,233 | 2,156 |
| 2020 | 1,697 | 1,339 | 1,175 | 1,278 | 1,402 | 1,658 | 1,715 | 1,975 | 1,980 | 2,040 | 2,088 | 1,940 |
| 2021 | 1,779 | 1,514 | 1,531 | 1,314 | 1,367 | 1,385 | 1,383 | 1,722 | 2,047 | 2,036 | 2,069 | 1,782 |
| 2022 | 1,199 | 915 | 799 | 612 | 553 | 459 | 418 | 387 | 400 | 514 | 879 | 1,328 |
| 2023 | 944 | 730 | 634 | 494 | 536 | 530 | 629 | 500 | 446 | 561 | 721 | 837 |
| 2024 | 914 | |||||||||||
| - = No Data Reported; -- = Not Applicable; NA = Not Available; W = Withheld to avoid disclosure of individual company data. |
| Release Date: 3/29/2024 |
| Next Release Date: 4/30/2024 |