|
Download Data (XLS File) |
|
||||||||
|
||||||||
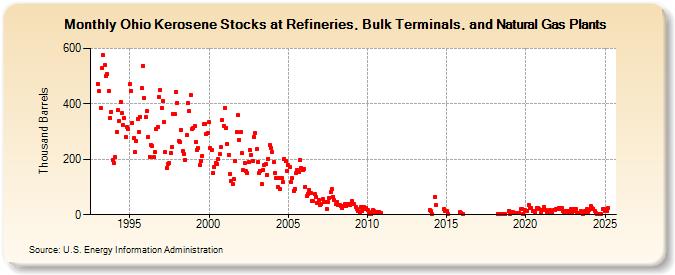
| Ohio Kerosene Stocks at Refineries, Bulk Terminals, and Natural Gas Plants (Thousand Barrels) | ||||||||
| Year | Jan | Feb | Mar | Apr | May | Jun | Jul | Aug | Sep | Oct | Nov | Dec |
|---|---|---|---|---|---|---|---|---|---|---|---|---|
| 1993 | 473 | 445 | 385 | 529 | 575 | 540 | 499 | 507 | 448 | 349 | 372 | 199 |
| 1994 | 187 | 209 | 300 | 376 | 338 | 406 | 366 | 325 | 348 | 279 | 316 | 310 |
| 1995 | 470 | 448 | 332 | 275 | 226 | 267 | 346 | 299 | 354 | 457 | 538 | 422 |
| 1996 | 352 | 373 | 282 | 210 | 253 | 247 | 207 | 227 | 309 | 315 | 426 | 450 |
| 1997 | 386 | 412 | 334 | 225 | 168 | 184 | 187 | 223 | 243 | 365 | 363 | 443 |
| 1998 | 404 | 266 | 262 | 306 | 230 | 219 | 199 | 286 | 402 | 373 | 433 | 311 |
| 1999 | 314 | 320 | 262 | 234 | 240 | 180 | 194 | 213 | 326 | 329 | 290 | 296 |
| 2000 | 333 | 241 | 233 | 152 | 171 | 188 | 183 | 201 | 219 | 243 | 342 | 321 |
| 2001 | 385 | 312 | 256 | 217 | 148 | 121 | 110 | 128 | 192 | 297 | 358 | 270 |
| 2002 | 298 | 221 | 162 | 188 | 156 | 149 | 189 | 235 | 216 | 195 | 280 | 293 |
| 2003 | 236 | 189 | 152 | 156 | 111 | 163 | 180 | 182 | 144 | 202 | 251 | 240 |
| 2004 | 226 | 190 | 151 | 133 | 101 | 132 | 93 | 133 | 117 | 201 | 192 | 159 |
| 2005 | 180 | 172 | 117 | 132 | 87 | 93 | 151 | 162 | 153 | 198 | 169 | 162 |
| 2006 | 166 | 100 | 67 | 74 | 90 | 78 | 51 | 48 | 74 | 65 | 44 | 52 |
| 2007 | 34 | 39 | 56 | 46 | 45 | 22 | 47 | 62 | 81 | 91 | 64 | 52 |
| 2008 | 37 | 46 | 34 | 36 | 32 | 24 | 30 | 38 | 30 | 37 | 37 | 35 |
| 2009 | 50 | 37 | 38 | 27 | 20 | 12 | 9 | 29 | 13 | 29 | 21 | 25 |
| 2010 | 17 | 9 | 4 | 1 | 16 | 12 | 8 | 10 | 8 | 10 | 7 | |
| 2013 | 17 | |||||||||||
| 2014 | 13 | 2 | 65 | 35 | 19 | 13 | ||||||
| 2015 | 13 | 4 | 9 | 5 | ||||||||
| 2016 | 2 | |||||||||||
| 2018 | 4 | 4 | 4 | 3 | 2 | 1 | 15 | |||||
| 2019 | 3 | 10 | 8 | 7 | 7 | 7 | 7 | 6 | 20 | 21 | 2 | 16 |
| 2020 | 13 | 15 | 35 | 24 | 23 | 12 | 15 | 11 | 25 | 26 | 19 | 7 |
| 2021 | 18 | 18 | 27 | 17 | 7 | 7 | 16 | 12 | 10 | 17 | 17 | 21 |
| 2022 | 21 | 26 | 21 | 26 | 14 | 11 | 14 | 12 | 10 | 13 | 19 | 6 |
| 2023 | 19 | 13 | 19 | 5 | 5 | 5 | 12 | 2 | 6 | 15 | 19 | 8 |
| 2024 | 16 | |||||||||||
| - = No Data Reported; -- = Not Applicable; NA = Not Available; W = Withheld to avoid disclosure of individual company data. |
| Release Date: 3/29/2024 |
| Next Release Date: 4/30/2024 |