|
Download Data (XLS File) |
|
||||||||
|
||||||||
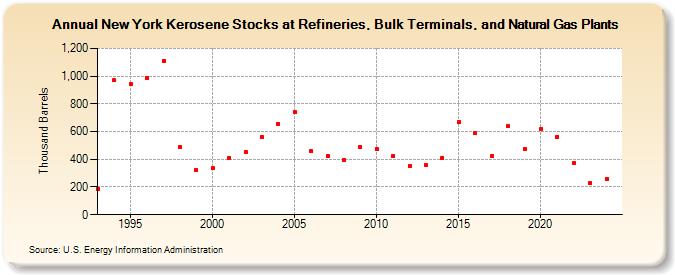
| New York Kerosene Stocks at Refineries, Bulk Terminals, and Natural Gas Plants (Thousand Barrels) | ||||||||
| Decade | Year-0 | Year-1 | Year-2 | Year-3 | Year-4 | Year-5 | Year-6 | Year-7 | Year-8 | Year-9 |
|---|---|---|---|---|---|---|---|---|---|---|
| 1990's | 185 | 969 | 942 | 988 | 1,111 | 489 | 321 | |||
| 2000's | 335 | 408 | 454 | 564 | 656 | 740 | 459 | 421 | 394 | 488 |
| 2010's | 471 | 425 | 354 | 357 | 408 | 668 | 587 | 423 | 637 | 474 |
| 2020's | 618 | 559 | 375 | 228 |
| - = No Data Reported; -- = Not Applicable; NA = Not Available; W = Withheld to avoid disclosure of individual company data. |
| Release Date: 3/29/2024 |
| Next Release Date: 8/30/2024 |