|
Download Data (XLS File) |
|
||||||||
|
||||||||
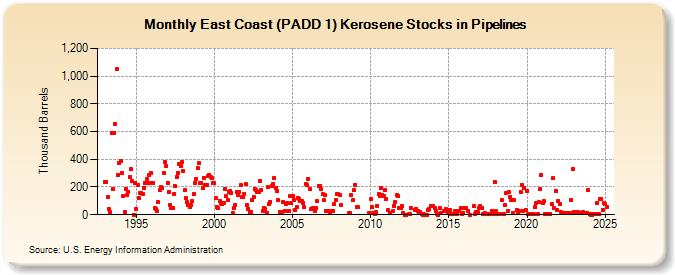
| East Coast (PADD 1) Kerosene Stocks in Pipelines (Thousand Barrels) | ||||||||
| Year | Jan | Feb | Mar | Apr | May | Jun | Jul | Aug | Sep | Oct | Nov | Dec |
|---|---|---|---|---|---|---|---|---|---|---|---|---|
| 1993 | 239 | 237 | 131 | 39 | 18 | 592 | 186 | 590 | 653 | 1,052 | 288 | 375 |
| 1994 | 385 | 300 | 132 | 19 | 186 | 143 | 166 | 271 | 331 | 246 | 1 | 230 |
| 1995 | 40 | 217 | 118 | 158 | 157 | 150 | 195 | 227 | 256 | 229 | 283 | 302 |
| 1996 | 228 | 226 | 52 | 39 | 26 | 89 | 176 | 199 | 190 | 298 | 379 | 353 |
| 1997 | 230 | 162 | 72 | 47 | 52 | 150 | 207 | 274 | 302 | 367 | 351 | 383 |
| 1998 | 315 | 176 | 117 | 91 | 73 | 59 | 68 | 100 | 146 | 226 | 257 | 339 |
| 1999 | 370 | 231 | 229 | 195 | 268 | 213 | 216 | 277 | 287 | 269 | 262 | 231 |
| 2000 | 228 | 118 | 54 | 52 | 102 | 87 | 75 | 83 | 187 | 133 | 107 | 165 |
| 2001 | 170 | 158 | 12 | 45 | 71 | 165 | 144 | 166 | 212 | 125 | 127 | 150 |
| 2002 | 218 | 69 | 44 | 21 | 23 | 104 | 126 | 188 | 180 | 162 | 166 | 242 |
| 2003 | 177 | 24 | 46 | 43 | 15 | 197 | 77 | 94 | 209 | 225 | 264 | 194 |
| 2004 | 168 | 106 | 22 | 15 | 20 | 90 | 29 | 78 | 84 | 27 | 133 | 83 |
| 2005 | 133 | 108 | 34 | 53 | 121 | 110 | 102 | 100 | 87 | 53 | 224 | 212 |
| 2006 | 258 | 186 | 40 | 40 | 47 | 29 | 45 | 97 | 207 | 210 | 183 | 146 |
| 2007 | 105 | 139 | 28 | 28 | 19 | 30 | 28 | 79 | 109 | 151 | 146 | |
| 2008 | 143 | 71 | 12 | 15 | 145 | 104 | 178 | |||||
| 2009 | 217 | 55 | 55 | 10 | ||||||||
| 2010 | 110 | 59 | 11 | 7 | 17 | 64 | 148 | 137 | 194 | 145 | 138 | 179 |
| 2011 | 113 | 31 | 9 | 25 | 65 | 94 | 142 | 136 | 47 | 51 | ||
| 2012 | 63 | 13 | 1 | 1 | 5 | 5 | 49 | 32 | 39 | |||
| 2013 | 28 | 15 | 19 | 5 | 1 | 2 | 1 | 1 | 34 | 38 | 64 | 64 |
| 2014 | 62 | 49 | 25 | 7 | 1 | 50 | 11 | 24 | 24 | 38 | 14 | |
| 2015 | 36 | 37 | 6 | 5 | 25 | 3 | 26 | 24 | 49 | 4 | 12 | |
| 2016 | 51 | 45 | 25 | 1 | 64 | 2 | 22 | 23 | 50 | |||
| 2017 | 62 | 49 | 4 | 10 | 2 | 3 | 29 | 2 | 237 | |||
| 2018 | 24 | 7 | 4 | 103 | 4 | 67 | 156 | 29 | 165 | 130 | ||
| 2019 | 109 | 15 | 107 | 31 | 12 | 25 | 165 | 213 | 24 | 191 | 35 | |
| 2020 | 173 | 2 | 2 | 2 | 2 | 2 | 57 | 81 | 8 | 89 | 184 | 287 |
| 2021 | 83 | 96 | 4 | 4 | 4 | 4 | 4 | 74 | 262 | 50 | 174 | 32 |
| 2022 | 101 | 74 | 17 | 15 | 11 | 10 | 10 | 10 | 10 | 10 | 108 | 331 |
| 2023 | 17 | 14 | 18 | 17 | 15 | 15 | 15 | 16 | 15 | 15 | 15 | 180 |
| 2024 | 3 | |||||||||||
| - = No Data Reported; -- = Not Applicable; NA = Not Available; W = Withheld to avoid disclosure of individual company data. |
| Release Date: 3/29/2024 |
| Next Release Date: 4/30/2024 |