|
Download Data (XLS File) |
|
||||||||
|
||||||||
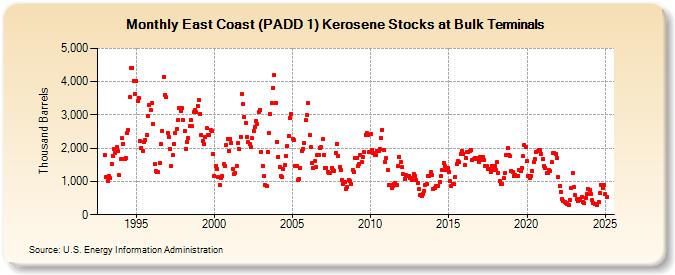
| East Coast (PADD 1) Kerosene Stocks at Bulk Terminals (Thousand Barrels) | ||||||||
| Year | Jan | Feb | Mar | Apr | May | Jun | Jul | Aug | Sep | Oct | Nov | Dec |
|---|---|---|---|---|---|---|---|---|---|---|---|---|
| 1993 | 1,797 | 1,132 | 1,012 | 1,152 | 1,103 | 1,531 | 1,773 | 1,984 | 1,867 | 2,027 | 1,907 | 1,192 |
| 1994 | 1,668 | 2,292 | 2,135 | 1,673 | 1,705 | 2,445 | 2,540 | 3,528 | 4,414 | 4,404 | 4,034 | 3,629 |
| 1995 | 4,024 | 3,413 | 3,517 | 2,205 | 2,014 | 1,917 | 2,178 | 2,236 | 2,394 | 2,971 | 3,310 | 3,146 |
| 1996 | 3,363 | 2,721 | 1,533 | 1,309 | 1,276 | 1,272 | 1,544 | 2,119 | 2,511 | 4,151 | 3,607 | 3,524 |
| 1997 | 2,459 | 2,342 | 1,986 | 1,454 | 1,783 | 2,126 | 2,457 | 2,585 | 2,854 | 3,223 | 3,107 | 3,212 |
| 1998 | 2,840 | 2,512 | 1,981 | 2,200 | 2,313 | 2,674 | 2,853 | 2,654 | 3,076 | 3,150 | 3,080 | 3,269 |
| 1999 | 3,435 | 3,028 | 2,399 | 2,219 | 2,114 | 2,348 | 2,599 | 2,408 | 2,401 | 2,557 | 2,528 | 1,820 |
| 2000 | 1,170 | 1,478 | 1,380 | 1,125 | 902 | 1,105 | 1,170 | 1,513 | 1,477 | 2,096 | 2,290 | 1,911 |
| 2001 | 2,290 | 2,156 | 1,385 | 1,235 | 1,260 | 1,474 | 2,152 | 1,962 | 2,346 | 3,641 | 3,322 | 2,937 |
| 2002 | 2,761 | 2,345 | 2,172 | 2,135 | 2,023 | 2,302 | 2,518 | 2,633 | 2,825 | 2,724 | 3,101 | 3,160 |
| 2003 | 1,885 | 1,469 | 1,149 | 884 | 851 | 1,891 | 2,453 | 3,015 | 3,350 | 3,818 | 4,198 | 3,359 |
| 2004 | 2,190 | 1,750 | 1,429 | 1,157 | 1,119 | 1,362 | 1,500 | 1,760 | 2,063 | 2,372 | 2,906 | 3,014 |
| 2005 | 2,289 | 2,232 | 1,474 | 1,474 | 1,047 | 1,067 | 1,407 | 1,919 | 1,970 | 2,151 | 2,840 | 3,007 |
| 2006 | 3,361 | 2,402 | 2,034 | 1,545 | 1,400 | 1,612 | 1,445 | 1,782 | 1,810 | 2,009 | 2,029 | 2,268 |
| 2007 | 1,801 | 1,415 | 1,410 | 1,290 | 1,240 | 1,257 | 1,415 | 1,354 | 1,323 | 1,850 | 2,133 | 1,776 |
| 2008 | 1,434 | 1,354 | 1,055 | 916 | 970 | 782 | 843 | 1,054 | 1,004 | 909 | 1,349 | 1,284 |
| 2009 | 1,704 | 1,717 | 1,454 | 1,511 | 1,796 | 1,570 | 1,732 | 1,898 | 2,406 | 2,456 | 2,390 | 1,895 |
| 2010 | 2,412 | 1,955 | 1,853 | 1,788 | 1,783 | 1,926 | 1,911 | 1,987 | 2,310 | 2,555 | 1,957 | 1,595 |
| 2011 | 1,695 | 1,353 | 908 | 896 | 811 | 863 | 921 | 953 | 901 | 1,473 | 1,750 | 1,576 |
| 2012 | 1,422 | 1,215 | 1,086 | 1,192 | 1,160 | 1,153 | 1,096 | 1,112 | 1,037 | 1,237 | 1,176 | 1,039 |
| 2013 | 962 | 771 | 590 | 550 | 636 | 721 | 890 | 912 | 1,178 | 1,165 | 1,270 | 1,185 |
| 2014 | 758 | 799 | 871 | 849 | 871 | 997 | 1,163 | 1,330 | 1,546 | 1,454 | 1,354 | 1,417 |
| 2015 | 1,281 | 1,001 | 869 | 914 | 910 | 1,137 | 1,512 | 1,601 | 1,570 | 1,839 | 1,910 | 1,838 |
| 2016 | 1,484 | 1,713 | 1,874 | 1,882 | 1,912 | 1,932 | 1,653 | 1,667 | 1,701 | 1,709 | 1,676 | 1,592 |
| 2017 | 1,733 | 1,648 | 1,745 | 1,646 | 1,461 | 1,465 | 1,365 | 1,369 | 1,279 | 1,476 | 1,339 | 1,464 |
| 2018 | 1,343 | 1,570 | 1,264 | 1,009 | 914 | 937 | 1,096 | 1,249 | 1,794 | 1,993 | 1,799 | 1,764 |
| 2019 | 1,316 | 1,275 | 1,153 | 1,207 | 1,156 | 1,173 | 1,357 | 1,327 | 1,398 | 1,753 | 2,093 | 2,025 |
| 2020 | 1,605 | 1,178 | 1,115 | 1,171 | 1,312 | 1,573 | 1,673 | 1,898 | 1,911 | 1,959 | 1,944 | 1,833 |
| 2021 | 1,661 | 1,451 | 1,416 | 1,239 | 1,264 | 1,330 | 1,309 | 1,575 | 1,868 | 1,858 | 1,836 | 1,719 |
| 2022 | 1,126 | 867 | 690 | 461 | 402 | 388 | 341 | 337 | 282 | 446 | 804 | 1,244 |
| 2023 | 837 | 566 | 458 | 404 | 437 | 468 | 533 | 388 | 344 | 516 | 620 | 769 |
| 2024 | 754 | |||||||||||
| - = No Data Reported; -- = Not Applicable; NA = Not Available; W = Withheld to avoid disclosure of individual company data. |
| Release Date: 3/29/2024 |
| Next Release Date: 4/30/2024 |