|
Download Data (XLS File) |
|
||||||||
|
||||||||
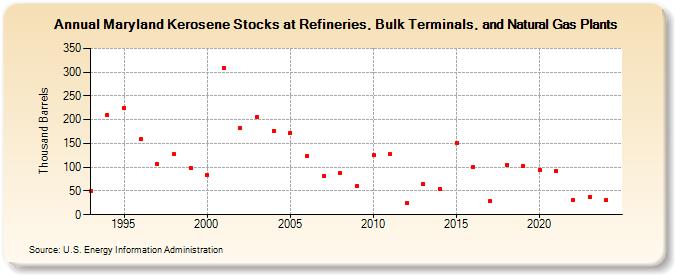
| Maryland Kerosene Stocks at Refineries, Bulk Terminals, and Natural Gas Plants (Thousand Barrels) | ||||||||
| Decade | Year-0 | Year-1 | Year-2 | Year-3 | Year-4 | Year-5 | Year-6 | Year-7 | Year-8 | Year-9 |
|---|---|---|---|---|---|---|---|---|---|---|
| 1990's | 50 | 210 | 225 | 159 | 107 | 127 | 99 | |||
| 2000's | 84 | 309 | 182 | 206 | 177 | 173 | 123 | 82 | 88 | 60 |
| 2010's | 125 | 127 | 25 | 65 | 54 | 151 | 100 | 28 | 105 | 103 |
| 2020's | 95 | 92 | 32 | 38 |
| - = No Data Reported; -- = Not Applicable; NA = Not Available; W = Withheld to avoid disclosure of individual company data. |
| Release Date: 8/30/2024 |
| Next Release Date: 8/29/2025 |