|
Download Data (XLS File) |
|
||||||||
|
||||||||
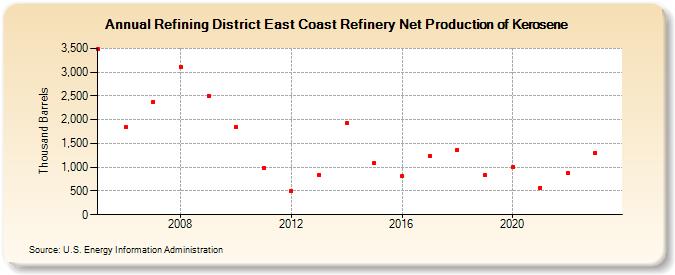
| Refining District East Coast Refinery Net Production of Kerosene (Thousand Barrels) | ||||||||
| Decade | Year-0 | Year-1 | Year-2 | Year-3 | Year-4 | Year-5 | Year-6 | Year-7 | Year-8 | Year-9 |
|---|---|---|---|---|---|---|---|---|---|---|
| 2000's | 3,485 | 1,849 | 2,380 | 3,115 | 2,507 | |||||
| 2010's | 1,845 | 986 | 499 | 846 | 1,940 | 1,089 | 817 | 1,240 | 1,371 | 829 |
| 2020's | 998 | 570 | 884 | 1,307 |
| - = No Data Reported; -- = Not Applicable; NA = Not Available; W = Withheld to avoid disclosure of individual company data. |
| Release Date: 6/28/2024 |
| Next Release Date: 8/30/2024 |
Referring Pages: