|
Download Data (XLS File) |
|
||||||||
|
||||||||
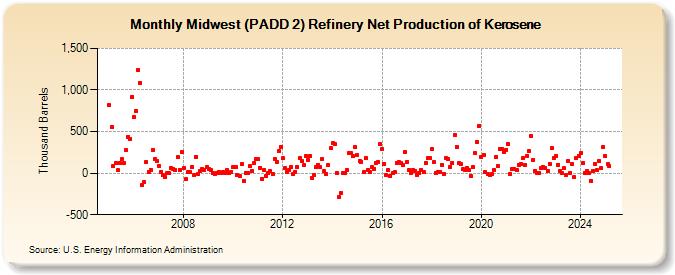
| Midwest (PADD 2) Refinery Net Production of Kerosene (Thousand Barrels) | ||||||||
| Year | Jan | Feb | Mar | Apr | May | Jun | Jul | Aug | Sep | Oct | Nov | Dec |
|---|---|---|---|---|---|---|---|---|---|---|---|---|
| 2005 | 816 | 553 | 88 | 117 | 32 | 125 | 165 | 118 | 277 | 440 | 411 | 920 |
| 2006 | 670 | 746 | 1,243 | 1,087 | -146 | -108 | 136 | 14 | 38 | 279 | 164 | 148 |
| 2007 | 87 | 17 | -24 | -46 | -3 | -1 | 57 | 48 | 40 | 192 | 42 | 252 |
| 2008 | 56 | -74 | 8 | 12 | 74 | -26 | 198 | -13 | 28 | 51 | 40 | 69 |
| 2009 | 53 | 32 | 6 | -9 | -1 | 11 | -1 | 15 | 7 | 35 | 4 | 19 |
| 2010 | 70 | 69 | -21 | -37 | 109 | -89 | 2 | 2 | 82 | 27 | 121 | 167 |
| 2011 | 165 | 67 | -65 | 36 | -38 | -4 | 21 | -5 | 175 | 137 | 262 | 315 |
| 2012 | 176 | 57 | 17 | 35 | 73 | -11 | 19 | 73 | 179 | 145 | 92 | 208 |
| 2013 | 160 | 203 | -53 | -18 | 73 | 98 | 72 | 170 | 20 | -8 | 96 | 299 |
| 2014 | 365 | 346 | 0 | -283 | -236 | 7 | 0 | 35 | 238 | 237 | 201 | 312 |
| 2015 | 218 | 147 | 135 | 9 | 184 | 35 | 13 | 70 | 55 | 125 | 139 | 347 |
| 2016 | 294 | 107 | -17 | 36 | -40 | -1 | 12 | 127 | 134 | 119 | 93 | 252 |
| 2017 | 134 | 38 | 2 | 39 | 23 | -26 | 1 | 35 | 13 | 123 | 182 | 179 |
| 2018 | 287 | 133 | 1 | 8 | 13 | 102 | -7 | 176 | 168 | 75 | 124 | 458 |
| 2019 | 318 | 121 | 106 | 45 | 35 | 67 | 32 | -35 | 69 | 239 | 376 | 570 |
| 2020 | 197 | 219 | 9 | -10 | -21 | -14 | 40 | 195 | 85 | 293 | 289 | 251 |
| 2021 | 282 | 352 | -9 | 55 | 52 | 38 | 101 | 113 | 182 | 97 | 208 | 266 |
| 2022 | 446 | 163 | 28 | 2 | 2 | 59 | 76 | 59 | 23 | 112 | 300 | 179 |
| 2023 | 210 | 103 | 23 | 2 | 58 | -27 | 147 | 7 | 105 | -44 | 181 | 212 |
| 2024 | 242 | |||||||||||
| - = No Data Reported; -- = Not Applicable; NA = Not Available; W = Withheld to avoid disclosure of individual company data. |
| Release Date: 3/29/2024 |
| Next Release Date: 4/30/2024 |
Referring Pages: