|
Download Data (XLS File) |
|
||||||||
|
||||||||
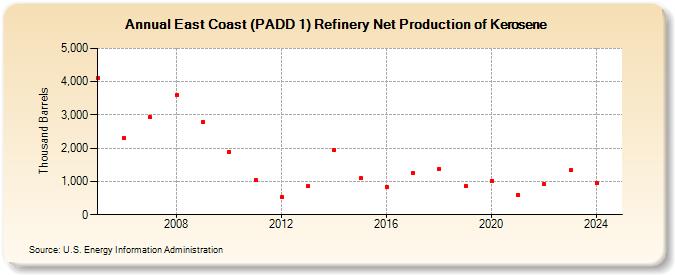
| East Coast (PADD 1) Refinery Net Production of Kerosene (Thousand Barrels) | ||||||||
| Decade | Year-0 | Year-1 | Year-2 | Year-3 | Year-4 | Year-5 | Year-6 | Year-7 | Year-8 | Year-9 |
|---|---|---|---|---|---|---|---|---|---|---|
| 2000's | 4,116 | 2,313 | 2,926 | 3,599 | 2,790 | |||||
| 2010's | 1,900 | 1,049 | 530 | 855 | 1,947 | 1,095 | 832 | 1,256 | 1,381 | 858 |
| 2020's | 1,028 | 602 | 915 | 1,331 |
| - = No Data Reported; -- = Not Applicable; NA = Not Available; W = Withheld to avoid disclosure of individual company data. |
| Release Date: 6/28/2024 |
| Next Release Date: 8/30/2024 |
Referring Pages: