|
Download Data (XLS File) |
|
||||||||
|
||||||||
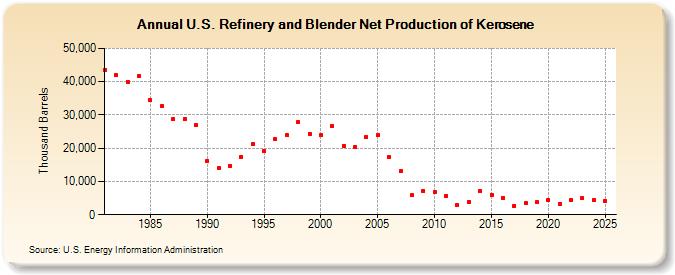
| U.S. Refinery and Blender Net Production of Kerosene (Thousand Barrels) | ||||||||
| Decade | Year-0 | Year-1 | Year-2 | Year-3 | Year-4 | Year-5 | Year-6 | Year-7 | Year-8 | Year-9 |
|---|---|---|---|---|---|---|---|---|---|---|
| 1980's | 43,521 | 41,937 | 39,977 | 41,808 | 34,475 | 32,647 | 28,691 | 28,770 | 26,938 | |
| 1990's | 16,281 | 13,952 | 14,768 | 17,438 | 21,138 | 19,182 | 22,758 | 23,887 | 27,848 | 24,353 |
| 2000's | 23,860 | 26,679 | 20,772 | 20,421 | 23,409 | 23,933 | 17,306 | 13,034 | 5,796 | 7,171 |
| 2010's | 6,880 | 5,749 | 2,771 | 3,946 | 7,052 | 5,937 | 5,167 | 2,738 | 3,395 | 3,709 |
| 2020's | 4,460 | 3,365 | 4,397 | 4,743 |
| - = No Data Reported; -- = Not Applicable; NA = Not Available; W = Withheld to avoid disclosure of individual company data. |
| Release Date: 3/29/2024 |
| Next Release Date: 8/30/2024 |