|
Download Data (XLS File) |
|
||||||||
|
||||||||
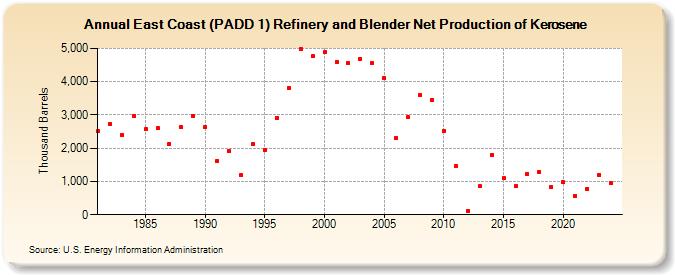
| East Coast (PADD 1) Refinery and Blender Net Production of Kerosene (Thousand Barrels) | ||||||||
| Decade | Year-0 | Year-1 | Year-2 | Year-3 | Year-4 | Year-5 | Year-6 | Year-7 | Year-8 | Year-9 |
|---|---|---|---|---|---|---|---|---|---|---|
| 1980's | 2,509 | 2,733 | 2,405 | 2,970 | 2,564 | 2,599 | 2,140 | 2,629 | 2,978 | |
| 1990's | 2,641 | 1,620 | 1,922 | 1,195 | 2,118 | 1,960 | 2,917 | 3,822 | 4,994 | 4,771 |
| 2000's | 4,882 | 4,595 | 4,559 | 4,683 | 4,553 | 4,116 | 2,313 | 2,926 | 3,599 | 3,451 |
| 2010's | 2,527 | 1,457 | 121 | 861 | 1,809 | 1,103 | 853 | 1,238 | 1,288 | 828 |
| 2020's | 977 | 570 | 788 | 1,207 | 949 |
| - = No Data Reported; -- = Not Applicable; NA = Not Available; W = Withheld to avoid disclosure of individual company data. |
| Release Date: 6/30/2025 |
| Next Release Date: 8/29/2025 |