|
Download Data (XLS File) |
|
||||||||
|
||||||||
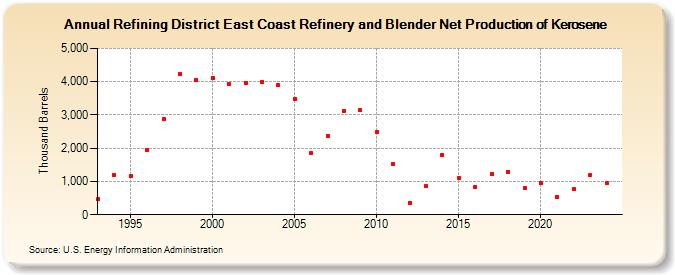
| Refining District East Coast Refinery and Blender Net Production of Kerosene (Thousand Barrels) | ||||||||
| Decade | Year-0 | Year-1 | Year-2 | Year-3 | Year-4 | Year-5 | Year-6 | Year-7 | Year-8 | Year-9 |
|---|---|---|---|---|---|---|---|---|---|---|
| 1990's | 472 | 1,188 | 1,170 | 1,960 | 2,880 | 4,228 | 4,046 | |||
| 2000's | 4,118 | 3,918 | 3,952 | 3,997 | 3,886 | 3,485 | 1,849 | 2,380 | 3,115 | 3,137 |
| 2010's | 2,472 | 1,524 | 365 | 852 | 1,802 | 1,097 | 838 | 1,222 | 1,278 | 801 |
| 2020's | 951 | 544 | 761 | 1,167 |
| - = No Data Reported; -- = Not Applicable; NA = Not Available; W = Withheld to avoid disclosure of individual company data. |
| Release Date: 3/29/2024 |
| Next Release Date: 8/30/2024 |