|
Download Data (XLS File) |
|
||||||||
|
||||||||
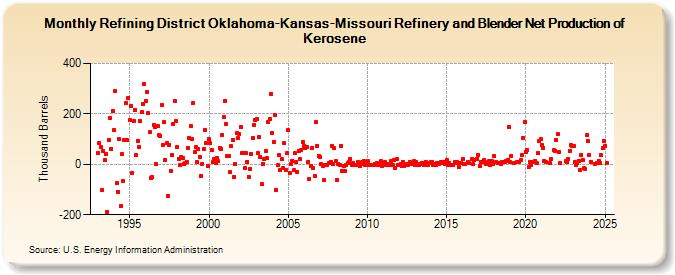
| Refining District Oklahoma-Kansas-Missouri Refinery and Blender Net Production of Kerosene (Thousand Barrels) | ||||||||
| Year | Jan | Feb | Mar | Apr | May | Jun | Jul | Aug | Sep | Oct | Nov | Dec |
|---|---|---|---|---|---|---|---|---|---|---|---|---|
| 1993 | 43 | 84 | 69 | -101 | 53 | 17 | 39 | -191 | 97 | 185 | 62 | 212 |
| 1994 | 136 | 290 | -74 | -108 | 102 | -164 | 39 | -68 | 97 | 242 | 96 | 264 |
| 1995 | 174 | 233 | -33 | 170 | 215 | 35 | 93 | 70 | 170 | 206 | 239 | 318 |
| 1996 | 252 | 286 | 202 | 127 | -56 | -51 | 155 | 148 | 1 | 150 | 116 | 114 |
| 1997 | 235 | 76 | 166 | 18 | 83 | -124 | 78 | -25 | 37 | 161 | 250 | 171 |
| 1998 | 67 | 23 | -1 | 29 | 26 | 3 | 6 | 11 | 65 | 106 | 151 | 101 |
| 1999 | 242 | 50 | 68 | 10 | 59 | 30 | -45 | 3 | 60 | 136 | 84 | -6 |
| 2000 | 99 | 83 | 56 | 11 | 23 | 5 | 24 | 12 | 65 | 62 | 116 | 187 |
| 2001 | 252 | 161 | 32 | 34 | -31 | 71 | 98 | -49 | 2 | 123 | 103 | 119 |
| 2002 | 148 | 43 | 43 | -14 | 43 | 11 | -49 | -17 | 41 | 106 | 157 | 176 |
| 2003 | 179 | 43 | 107 | 30 | -80 | 3 | 23 | 52 | 24 | 166 | 179 | 280 |
| 2004 | 124 | 90 | 194 | -102 | -4 | 35 | -21 | 21 | -16 | 85 | -21 | 43 |
| 2005 | 135 | -33 | 1 | 15 | -24 | 43 | 10 | -30 | 53 | 22 | 58 | 87 |
| 2006 | 73 | 64 | 69 | 10 | -57 | -6 | 66 | -15 | -47 | 166 | 74 | 34 |
| 2007 | 27 | 1 | -7 | -61 | -2 | -3 | 4 | 10 | 74 | 1 | 63 | |
| 2008 | 12 | -63 | 1 | -2 | 74 | -25 | -8 | -28 | -3 | 4 | 9 | 23 |
| 2009 | -2 | 7 | -1 | -3 | -1 | 10 | -5 | 2 | 8 | 14 | -3 | -1 |
| 2010 | 12 | -3 | -2 | -4 | -2 | -1 | 1 | 6 | -2 | 1 | 12 | -5 |
| 2011 | -2 | 9 | -1 | 2 | -3 | -3 | 12 | -3 | 17 | -13 | 21 | -2 |
| 2012 | -4 | 3 | -7 | 11 | -6 | -2 | 2 | -2 | 11 | 0 | 1 | 13 |
| 2013 | -3 | 8 | -4 | -1 | 0 | 5 | 4 | -4 | 11 | 3 | -2 | 7 |
| 2014 | 8 | 9 | -4 | 3 | -3 | 6 | 0 | 6 | 10 | 7 | 9 | 3 |
| 2015 | 17 | -3 | 4 | -3 | -1 | -3 | 9 | 6 | 9 | -9 | 4 | 5 |
| 2016 | 22 | 2 | 1 | 10 | 5 | 22 | 1 | 18 | 21 | |||
| 2017 | 38 | -8 | 9 | 10 | 16 | 9 | 1 | 7 | 13 | -2 | 13 | 3 |
| 2018 | 32 | 9 | 4 | 4 | 3 | 8 | 8 | 10 | 15 | 16 | 148 | |
| 2019 | 8 | 32 | 7 | 8 | 11 | 11 | 17 | 35 | 105 | 167 | ||
| 2020 | 50 | 56 | -12 | 10 | -3 | 9 | 14 | 4 | 44 | 92 | 100 | |
| 2021 | 76 | 66 | 14 | 8 | 5 | 23 | 56 | 54 | 98 | |||
| 2022 | 119 | 50 | 4 | 12 | 8 | 21 | 52 | 75 | 74 | |||
| 2023 | 73 | 9 | -4 | 7 | 14 | -24 | 37 | 18 | -16 | -20 | 115 | 93 |
| 2024 | 36 | 11 | ||||||||||
| - = No Data Reported; -- = Not Applicable; NA = Not Available; W = Withheld to avoid disclosure of individual company data. |
| Release Date: 6/28/2024 |
| Next Release Date: 7/31/2024 |