|
Download Data (XLS File) |
|
||||||||
|
||||||||
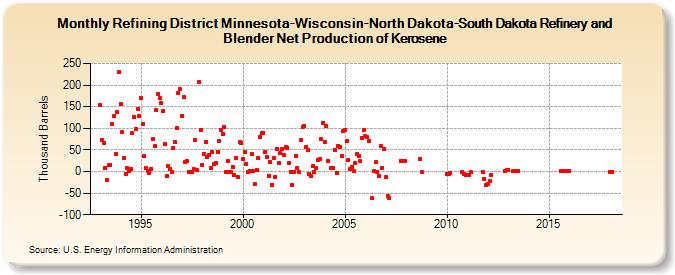
| Refining District Minnesota-Wisconsin-North Dakota-South Dakota Refinery and Blender Net Production of Kerosene (Thousand Barrels) | ||||||||
| Year | Jan | Feb | Mar | Apr | May | Jun | Jul | Aug | Sep | Oct | Nov | Dec |
|---|---|---|---|---|---|---|---|---|---|---|---|---|
| 1993 | 153 | 74 | 66 | 7 | -19 | 14 | 14 | 111 | 128 | 40 | 137 | 230 |
| 1994 | 156 | 92 | 32 | -5 | 7 | 1 | 5 | 89 | 125 | 98 | 145 | 129 |
| 1995 | 171 | 109 | 35 | 7 | 1 | -4 | 6 | 76 | 58 | 142 | 179 | 171 |
| 1996 | 159 | 139 | 64 | -11 | 12 | 6 | -2 | 55 | 68 | 100 | 182 | 190 |
| 1997 | 129 | 172 | 21 | 25 | -2 | 0 | 0 | 5 | 74 | 4 | 206 | 95 |
| 1998 | 14 | 41 | 68 | 33 | 39 | 8 | 45 | 17 | 19 | 46 | 70 | 97 |
| 1999 | 87 | 102 | 0 | 24 | 0 | -1 | 10 | -9 | 31 | -13 | 68 | 66 |
| 2000 | 30 | 46 | 18 | 0 | 2 | 41 | 1 | -29 | 4 | 31 | 81 | 90 |
| 2001 | 90 | 46 | 34 | -10 | 22 | -32 | 31 | -12 | 53 | 19 | 43 | 53 |
| 2002 | 39 | 56 | 55 | 20 | 0 | -31 | 0 | 36 | 8 | 0 | 74 | 103 |
| 2003 | 106 | 57 | 49 | -5 | -11 | 12 | 0 | 9 | 26 | 30 | 76 | 113 |
| 2004 | 69 | 105 | 25 | 7 | 8 | 49 | -4 | 60 | 57 | 35 | 93 | |
| 2005 | 96 | 71 | 27 | 5 | 10 | 2 | 19 | 41 | 36 | 24 | 78 | 96 |
| 2006 | 82 | 79 | 70 | -61 | 1 | 21 | -2 | -11 | 58 | 9 | 52 | |
| 2007 | -13 | -57 | -62 | 25 | 25 | |||||||
| 2008 | 30 | 0 | ||||||||||
| 2010 | -5 | -5 | -4 | -1 | -5 | -7 | ||||||
| 2011 | -7 | -7 | -2 | 0 | -17 | -31 | ||||||
| 2012 | -28 | -23 | -7 | 2 | 4 | |||||||
| 2013 | 4 | 1 | 1 | 1 | 2 | |||||||
| 2015 | 1 | 1 | 1 | |||||||||
| 2016 | 1 | |||||||||||
| 2018 | 0 | 0 | ||||||||||
| - = No Data Reported; -- = Not Applicable; NA = Not Available; W = Withheld to avoid disclosure of individual company data. |
| Release Date: 3/29/2024 |
| Next Release Date: 4/30/2024 |