|
Download Data (XLS File) |
|
||||||||
|
||||||||
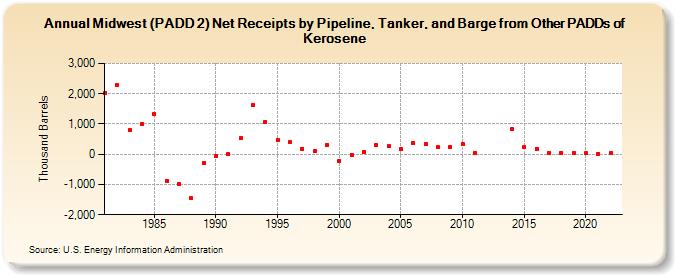
| Midwest (PADD 2) Net Receipts by Pipeline, Tanker, and Barge from Other PADDs of Kerosene (Thousand Barrels) | ||||||||
| Decade | Year-0 | Year-1 | Year-2 | Year-3 | Year-4 | Year-5 | Year-6 | Year-7 | Year-8 | Year-9 |
|---|---|---|---|---|---|---|---|---|---|---|
| 1980's | 2,025 | 2,280 | 799 | 1,001 | 1,334 | -879 | -991 | -1,461 | -277 | |
| 1990's | -58 | 4 | 532 | 1,627 | 1,068 | 466 | 390 | 187 | 91 | 314 |
| 2000's | -210 | -21 | 79 | 306 | 257 | 160 | 367 | 343 | 236 | 235 |
| 2010's | 322 | 33 | 832 | 228 | 182 | 47 | 45 | 34 | ||
| 2020's | 25 | 19 | 26 |
| - = No Data Reported; -- = Not Applicable; NA = Not Available; W = Withheld to avoid disclosure of individual company data. |
| Release Date: 3/29/2024 |
| Next Release Date: 8/30/2024 |