|
Download Data (XLS File) |
|
||||||||
|
||||||||
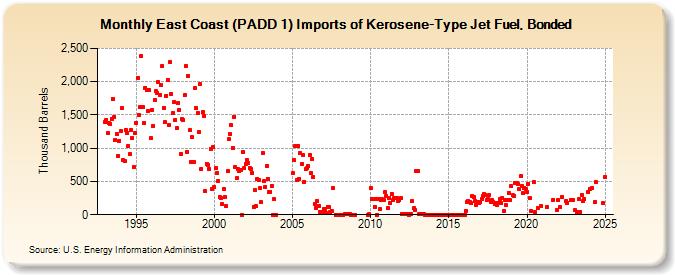
| East Coast (PADD 1) Imports of Kerosene-Type Jet Fuel, Bonded (Thousand Barrels) | ||||||||
| Year | Jan | Feb | Mar | Apr | May | Jun | Jul | Aug | Sep | Oct | Nov | Dec |
|---|---|---|---|---|---|---|---|---|---|---|---|---|
| 1993 | 1,399 | 1,424 | 1,228 | 1,381 | 1,365 | 1,444 | 1,744 | 1,470 | 1,130 | 1,220 | 884 | 1,114 |
| 1994 | 1,253 | 1,605 | 822 | 809 | 1,277 | 1,229 | 1,033 | 913 | 1,276 | 1,149 | 719 | 1,229 |
| 1995 | 1,383 | 2,062 | 1,506 | 1,617 | 2,385 | 1,613 | 1,384 | 1,912 | 1,869 | 1,563 | 1,872 | 1,148 |
| 1996 | 1,578 | 1,336 | 1,722 | 1,858 | 1,832 | 1,994 | 1,801 | 1,946 | 2,236 | 1,606 | 1,388 | 1,790 |
| 1997 | 2,032 | 1,347 | 2,291 | 1,811 | 1,531 | 1,691 | 1,429 | 1,302 | 1,679 | 1,575 | 912 | 1,440 |
| 1998 | 1,425 | 1,797 | 2,237 | 949 | 2,091 | 1,273 | 791 | 1,164 | 791 | 1,904 | 1,601 | 1,530 |
| 1999 | 1,245 | 1,961 | 686 | 1,538 | 1,482 | 349 | 766 | 751 | 687 | 990 | 381 | 1,019 |
| 2000 | 422 | 698 | 633 | 503 | 260 | 250 | 159 | 392 | 264 | 128 | 655 | 1,132 |
| 2001 | 1,216 | 1,343 | 1,009 | 1,476 | 717 | 545 | 682 | 658 | 670 | 0 | 937 | 697 |
| 2002 | 765 | 820 | 784 | 703 | 688 | 629 | 122 | 373 | 125 | 535 | 527 | 405 |
| 2003 | 185 | 929 | 502 | 420 | 729 | 544 | 334 | 346 | 437 | 0 | 229 | 0 |
| 2005 | 623 | 821 | 1,032 | 517 | 1,038 | 544 | 927 | 769 | 900 | 497 | 680 | 695 |
| 2006 | 739 | 896 | 626 | 836 | 564 | 167 | 102 | 202 | 137 | 47 | 47 | 46 |
| 2007 | 81 | 81 | 21 | 120 | 111 | 41 | 61 | 401 | 2 | 2 | 1 | |
| 2008 | 1 | 1 | 3 | 3 | 7 | 5 | 6 | 6 | 4 | 2 | 2 | 3 |
| 2009 | 1 | 3 | 4 | |||||||||
| 2010 | 405 | 234 | 235 | 120 | 243 | 3 | 237 | 82 | 221 | 232 | 224 | 337 |
| 2011 | 286 | 102 | 256 | 176 | 314 | 214 | 245 | 247 | 257 | 207 | 217 | 246 |
| 2012 | 6 | 7 | 7 | 5 | 4 | 3 | 5 | 6 | 207 | 94 | 78 | 651 |
| 2013 | 656 | 7 | 8 | 8 | 5 | 5 | 1 | 1 | 1 | 1 | 1 | 1 |
| 2014 | 1 | 1 | 1 | 1 | 1 | 1 | 1 | 1 | 1 | 1 | 1 | 1 |
| 2015 | 1 | 1 | 1 | 1 | 1 | 1 | 1 | 1 | 1 | 1 | 1 | 1 |
| 2016 | 1 | 59 | 194 | 206 | 191 | 172 | 279 | 260 | 209 | 153 | 186 | 181 |
| 2017 | 187 | 234 | 277 | 313 | 296 | 226 | 237 | 290 | 196 | 226 | 187 | 154 |
| 2018 | 170 | 148 | 173 | 232 | 176 | 250 | 52 | 224 | 143 | 216 | 329 | 214 |
| 2019 | 429 | 289 | 282 | 479 | 470 | 464 | 381 | 577 | 433 | 321 | 409 | 383 |
| 2020 | 347 | 466 | 245 | 56 | 495 | 39 | 99 | 130 | ||||
| 2021 | 119 | 225 | 74 | |||||||||
| 2022 | 215 | 110 | 265 | 212 | 180 | 222 | 219 | |||||
| 2023 | 66 | 35 | 238 | 40 | 302 | 199 | 235 | 341 | ||||
| 2024 | 381 | |||||||||||
| - = No Data Reported; -- = Not Applicable; NA = Not Available; W = Withheld to avoid disclosure of individual company data. |
| Release Date: 3/29/2024 |
| Next Release Date: 4/30/2024 |