|
Download Data (XLS File) |
|
||||||||
|
||||||||
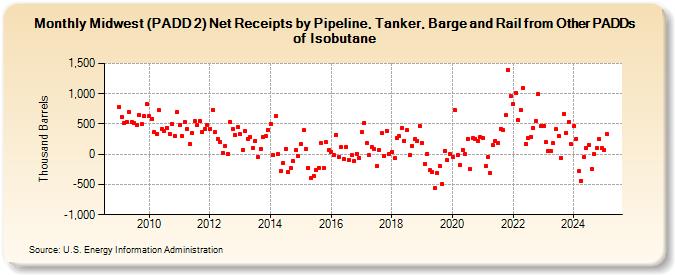
| Midwest (PADD 2) Net Receipts by Pipeline, Tanker, Barge and Rail from Other PADDs of Isobutane (Thousand Barrels) | ||||||||
| Year | Jan | Feb | Mar | Apr | May | Jun | Jul | Aug | Sep | Oct | Nov | Dec |
|---|---|---|---|---|---|---|---|---|---|---|---|---|
| 2009 | 787 | 618 | 510 | 533 | 697 | 535 | 511 | 484 | 654 | 502 | 625 | 822 |
| 2010 | 627 | 587 | 370 | 342 | 723 | 423 | 392 | 434 | 340 | 497 | 307 | 690 |
| 2011 | 476 | 305 | 531 | 418 | 172 | 354 | 542 | 483 | 546 | 370 | 425 | 490 |
| 2012 | 418 | 738 | 363 | 252 | 203 | 27 | 140 | 6 | 540 | 417 | 320 | 445 |
| 2013 | 328 | 71 | 386 | 253 | 284 | 109 | 226 | -43 | 93 | 291 | 297 | 404 |
| 2014 | 507 | -18 | 624 | 3 | -280 | -144 | 92 | -290 | -224 | -120 | 65 | -30 |
| 2015 | 172 | 397 | 90 | -222 | -400 | -356 | -267 | -227 | 186 | -226 | 196 | 73 |
| 2016 | 44 | -9 | 318 | -50 | 118 | -83 | 112 | -92 | -21 | -115 | 8 | -59 |
| 2017 | 362 | 524 | 179 | -20 | 122 | 86 | -193 | 63 | 344 | -33 | 389 | 6 |
| 2018 | 38 | -66 | 269 | 296 | 441 | 226 | 400 | -15 | 144 | 245 | 219 | 465 |
| 2019 | 185 | -155 | 11 | -268 | -290 | -562 | -313 | -193 | -490 | 61 | -95 | -2 |
| 2020 | -44 | 726 | -12 | -175 | 74 | -4 | 255 | -247 | 263 | 248 | 211 | 277 |
| 2021 | 271 | -195 | -46 | -310 | 150 | 223 | 182 | 424 | 400 | 643 | 1,389 | 956 |
| 2022 | 828 | 1,017 | 558 | 728 | 1,087 | 174 | 262 | 289 | 437 | 555 | 996 | 462 |
| 2023 | 467 | 194 | 47 | 46 | 180 | 409 | 302 | -55 | 671 | 359 | 540 | 165 |
| 2024 | 462 | 254 | -282 | -437 | -38 | 110 | 155 | -247 | 0 | 101 | 254 | 100 |
| 2025 | 73 | 333 | 20 | -130 | ||||||||
| - = No Data Reported; -- = Not Applicable; NA = Not Available; W = Withheld to avoid disclosure of individual company data. |
| Release Date: 6/30/2025 |
| Next Release Date: 7/31/2025 |