|
Download Data (XLS File) |
|
||||||||
|
||||||||
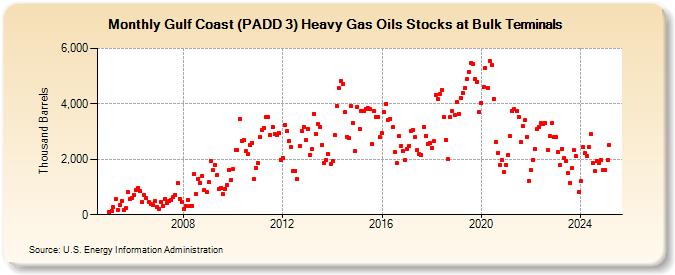
| Gulf Coast (PADD 3) Heavy Gas Oils Stocks at Bulk Terminals (Thousand Barrels) | ||||||||
| Year | Jan | Feb | Mar | Apr | May | Jun | Jul | Aug | Sep | Oct | Nov | Dec |
|---|---|---|---|---|---|---|---|---|---|---|---|---|
| 2005 | 107 | 130 | 278 | 558 | 184 | 343 | 492 | 161 | 250 | 817 | 578 | 605 |
| 2006 | 707 | 894 | 971 | 842 | 465 | 700 | 599 | 447 | 387 | 362 | 484 | 286 |
| 2007 | 221 | 476 | 331 | 581 | 416 | 504 | 546 | 636 | 721 | 1,127 | 580 | 458 |
| 2008 | 202 | 300 | 547 | 312 | 325 | 1,468 | 749 | 1,299 | 1,152 | 1,400 | 877 | 821 |
| 2009 | 1,173 | 1,950 | 1,598 | 1,804 | 1,419 | 911 | 980 | 738 | 930 | 1,074 | 1,615 | 1,258 |
| 2010 | 1,633 | 2,331 | 2,328 | 3,437 | 2,662 | 2,681 | 2,282 | 2,174 | 2,497 | 2,597 | 1,290 | 1,701 |
| 2011 | 1,858 | 2,809 | 3,049 | 3,142 | 3,519 | 3,514 | 2,875 | 3,173 | 2,916 | 2,872 | 2,955 | 1,986 |
| 2012 | 2,051 | 3,251 | 3,013 | 2,673 | 2,427 | 1,575 | 1,589 | 1,277 | 2,471 | 3,018 | 3,157 | 2,679 |
| 2013 | 3,097 | 2,156 | 2,372 | 3,648 | 2,921 | 3,269 | 3,158 | 2,531 | 1,855 | 1,970 | 2,186 | 1,821 |
| 2014 | 1,945 | 2,866 | 3,930 | 4,560 | 4,814 | 4,731 | 3,691 | 2,819 | 2,761 | 3,933 | 3,317 | 2,304 |
| 2015 | 3,892 | 3,103 | 3,739 | 3,752 | 3,831 | 3,840 | 3,802 | 2,550 | 3,734 | 3,525 | 3,536 | 2,799 |
| 2016 | 2,935 | 3,695 | 4,006 | 3,431 | 3,466 | 3,163 | 2,249 | 1,874 | 2,848 | 2,491 | 2,307 | 1,959 |
| 2017 | 2,371 | 2,492 | 3,035 | 3,067 | 2,791 | 2,334 | 2,178 | 2,156 | 3,164 | 2,856 | 2,569 | 2,587 |
| 2018 | 2,411 | 2,647 | 4,329 | 4,160 | 4,358 | 4,510 | 3,519 | 2,706 | 1,992 | 3,510 | 3,731 | 3,587 |
| 2019 | 4,068 | 3,641 | 4,223 | 4,392 | 4,566 | 4,894 | 5,162 | 5,488 | 5,429 | 4,901 | 4,802 | 3,706 |
| 2020 | 4,043 | 4,596 | 5,298 | 4,572 | 5,547 | 5,411 | 4,186 | 2,639 | 2,232 | 1,788 | 1,973 | 1,524 |
| 2021 | 1,796 | 2,160 | 2,842 | 3,737 | 3,798 | 3,750 | 3,539 | 2,620 | 3,192 | 3,400 | 2,809 | 1,224 |
| 2022 | 1,631 | 1,983 | 2,369 | 3,104 | 3,180 | 3,298 | 3,288 | 3,321 | 2,334 | 2,829 | 3,303 | 2,792 |
| 2023 | 2,821 | 2,245 | 1,799 | 2,390 | 2,031 | 1,926 | 1,490 | 1,159 | 1,673 | 2,322 | 2,107 | 825 |
| 2024 | 1,204 | 2,429 | 2,217 | 2,108 | ||||||||
| - = No Data Reported; -- = Not Applicable; NA = Not Available; W = Withheld to avoid disclosure of individual company data. |
| Release Date: 6/28/2024 |
| Next Release Date: 7/31/2024 |