|
Download Data (XLS File) |
|
||||||||
|
||||||||
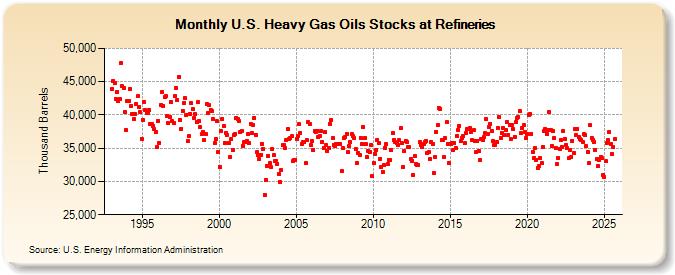
| U.S. Heavy Gas Oils Stocks at Refineries (Thousand Barrels) | ||||||||
| Year | Jan | Feb | Mar | Apr | May | Jun | Jul | Aug | Sep | Oct | Nov | Dec |
|---|---|---|---|---|---|---|---|---|---|---|---|---|
| 1993 | 43,902 | 45,145 | 44,844 | 42,344 | 43,485 | 42,035 | 42,461 | 47,738 | 44,272 | 44,092 | 40,502 | 37,710 |
| 1994 | 42,085 | 42,128 | 43,923 | 41,309 | 40,078 | 39,352 | 40,107 | 41,631 | 42,798 | 41,223 | 40,370 | 36,435 |
| 1995 | 39,288 | 41,952 | 40,701 | 40,223 | 40,305 | 40,701 | 38,648 | 38,621 | 38,321 | 37,817 | 37,440 | 35,158 |
| 1996 | 39,142 | 35,835 | 41,524 | 43,408 | 41,404 | 42,702 | 42,797 | 39,902 | 38,726 | 39,639 | 42,004 | 39,037 |
| 1997 | 38,786 | 42,866 | 44,083 | 42,263 | 45,740 | 39,307 | 37,951 | 40,651 | 41,802 | 42,535 | 40,034 | 36,016 |
| 1998 | 36,796 | 40,197 | 41,718 | 40,829 | 39,538 | 40,114 | 38,992 | 41,897 | 39,063 | 38,204 | 37,156 | 37,478 |
| 1999 | 36,217 | 37,135 | 41,568 | 40,358 | 41,417 | 40,789 | 40,542 | 39,332 | 35,761 | 36,401 | 39,016 | 34,464 |
| 2000 | 32,214 | 37,654 | 39,392 | 38,376 | 35,765 | 37,317 | 37,037 | 35,794 | 33,651 | 36,360 | 34,782 | 36,982 |
| 2001 | 37,162 | 39,560 | 39,314 | 39,018 | 37,466 | 37,593 | 35,400 | 35,861 | 35,901 | 36,106 | 37,204 | 35,732 |
| 2002 | 38,642 | 37,233 | 38,548 | 39,604 | 36,985 | 34,401 | 33,995 | 33,404 | 34,043 | 35,697 | 34,944 | 28,007 |
| 2003 | 30,245 | 32,370 | 33,884 | 32,764 | 32,124 | 34,843 | 33,950 | 33,145 | 33,136 | 32,624 | 31,121 | 29,941 |
| 2004 | 31,648 | 35,412 | 35,444 | 34,964 | 36,185 | 37,865 | 36,394 | 36,487 | 36,792 | 33,029 | 33,236 | 33,253 |
| 2005 | 36,400 | 36,816 | 38,582 | 37,337 | 35,595 | 35,903 | 35,871 | 32,746 | 36,161 | 38,866 | 38,588 | 35,492 |
| 2006 | 36,076 | 34,673 | 37,543 | 37,489 | 37,604 | 36,713 | 36,876 | 37,515 | 35,961 | 35,041 | 37,379 | 35,449 |
| 2007 | 34,527 | 35,006 | 38,636 | 39,286 | 36,563 | 35,499 | 35,347 | 35,671 | 35,605 | 35,608 | 35,654 | 31,542 |
| 2008 | 35,010 | 36,606 | 36,746 | 37,146 | 34,379 | 35,378 | 35,893 | 37,156 | 36,817 | 36,477 | 34,892 | 32,798 |
| 2009 | 34,302 | 33,981 | 36,571 | 35,689 | 38,216 | 36,509 | 35,581 | 33,616 | 34,601 | 34,393 | 35,504 | 30,754 |
| 2010 | 32,776 | 34,193 | 34,666 | 36,234 | 35,749 | 33,378 | 32,180 | 31,440 | 32,430 | 35,068 | 35,621 | 32,587 |
| 2011 | 33,242 | 33,230 | 34,787 | 37,241 | 36,272 | 35,858 | 35,713 | 35,507 | 36,188 | 38,009 | 35,730 | 32,227 |
| 2012 | 34,577 | 36,105 | 35,894 | 35,217 | 35,115 | 33,345 | 33,075 | 30,984 | 33,786 | 32,674 | 32,458 | 32,527 |
| 2013 | 35,935 | 35,486 | 35,142 | 35,688 | 35,869 | 36,099 | 34,333 | 34,382 | 33,388 | 35,857 | 35,638 | 31,269 |
| 2014 | 33,684 | 37,499 | 38,454 | 41,056 | 40,918 | 36,228 | 36,301 | 33,698 | 36,490 | 38,861 | 35,647 | 32,781 |
| 2015 | 35,562 | 35,791 | 34,657 | 35,807 | 34,995 | 36,832 | 37,794 | 38,353 | 36,031 | 36,600 | 36,781 | 35,763 |
| 2016 | 37,322 | 37,944 | 37,830 | 38,054 | 37,443 | 36,157 | 37,686 | 36,083 | 34,408 | 36,120 | 34,583 | 33,260 |
| 2017 | 36,320 | 36,225 | 36,636 | 37,236 | 39,379 | 37,197 | 38,254 | 38,686 | 37,600 | 36,071 | 35,416 | 35,503 |
| 2018 | 35,916 | 37,962 | 39,672 | 36,494 | 37,349 | 38,084 | 36,966 | 37,743 | 38,934 | 37,051 | 38,428 | 36,449 |
| 2019 | 38,419 | 37,819 | 36,753 | 38,923 | 39,510 | 39,669 | 40,521 | 37,232 | 38,078 | 38,429 | 37,422 | 36,504 |
| 2020 | 37,198 | 40,032 | 40,200 | 37,182 | 34,459 | 33,566 | 35,046 | 33,292 | 32,026 | 32,285 | 33,481 | 32,712 |
| 2021 | 35,238 | 37,548 | 37,879 | 37,098 | 37,777 | 40,451 | 37,724 | 35,305 | 37,513 | 36,540 | 34,998 | 32,551 |
| 2022 | 33,544 | 34,880 | 36,223 | 35,205 | 37,607 | 36,389 | 35,513 | 34,979 | 33,481 | 34,793 | 33,623 | 36,119 |
| 2023 | 34,287 | 37,942 | 36,904 | 37,973 | 36,648 | 36,371 | 36,164 | 35,986 | 37,094 | 36,971 | 35,274 | 34,436 |
| 2024 | 33,363 | 38,967 | 36,965 | 36,398 | ||||||||
| - = No Data Reported; -- = Not Applicable; NA = Not Available; W = Withheld to avoid disclosure of individual company data. |
| Release Date: 6/28/2024 |
| Next Release Date: 7/31/2024 |
Referring Pages: