|
Download Data (XLS File) |
|
||||||||
|
||||||||
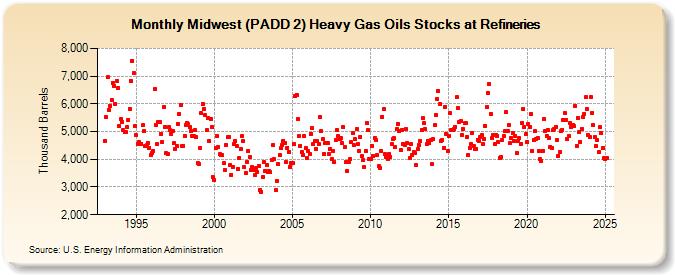
| Midwest (PADD 2) Heavy Gas Oils Stocks at Refineries (Thousand Barrels) | ||||||||
| Year | Jan | Feb | Mar | Apr | May | Jun | Jul | Aug | Sep | Oct | Nov | Dec |
|---|---|---|---|---|---|---|---|---|---|---|---|---|
| 1993 | 4,669 | 5,519 | 6,951 | 5,788 | 5,928 | 6,145 | 6,766 | 6,655 | 6,002 | 6,838 | 6,577 | 5,199 |
| 1994 | 5,436 | 5,348 | 5,041 | 4,975 | 4,975 | 5,168 | 5,429 | 5,815 | 6,829 | 7,556 | 7,115 | 5,200 |
| 1995 | 4,862 | 4,546 | 4,615 | 4,540 | 4,569 | 5,225 | 5,016 | 4,473 | 4,510 | 4,584 | 4,422 | 4,164 |
| 1996 | 4,232 | 4,308 | 6,525 | 5,236 | 4,546 | 5,358 | 5,351 | 4,923 | 4,616 | 5,900 | 5,172 | 4,217 |
| 1997 | 4,201 | 5,152 | 5,054 | 4,923 | 5,027 | 4,574 | 4,377 | 4,484 | 5,287 | 5,637 | 5,960 | 4,481 |
| 1998 | 4,493 | 4,843 | 5,241 | 5,317 | 5,255 | 5,155 | 5,020 | 4,834 | 4,838 | 5,054 | 4,796 | 3,869 |
| 1999 | 3,814 | 4,413 | 5,653 | 6,000 | 5,823 | 5,580 | 5,050 | 5,483 | 4,656 | 5,442 | 5,162 | 3,348 |
| 2000 | 3,246 | 4,390 | 4,839 | 4,449 | 4,175 | 4,139 | 4,144 | 3,855 | 3,629 | 4,531 | 4,788 | 4,806 |
| 2001 | 3,788 | 3,445 | 3,714 | 4,552 | 4,656 | 4,484 | 3,667 | 4,047 | 4,355 | 4,823 | 4,658 | 3,705 |
| 2002 | 3,500 | 3,910 | 4,283 | 4,073 | 3,616 | 3,729 | 3,605 | 3,420 | 3,676 | 3,536 | 3,761 | 2,888 |
| 2003 | 2,833 | 3,370 | 3,895 | 3,588 | 3,789 | 3,534 | 3,587 | 3,525 | 3,987 | 4,517 | 4,002 | 2,880 |
| 2004 | 3,225 | 3,823 | 4,146 | 4,401 | 4,530 | 4,672 | 4,579 | 3,891 | 4,420 | 4,276 | 3,739 | 3,860 |
| 2005 | 3,876 | 4,536 | 6,286 | 6,332 | 5,444 | 4,827 | 4,478 | 4,271 | 4,170 | 4,823 | 4,396 | 4,060 |
| 2006 | 4,282 | 4,183 | 4,929 | 5,115 | 4,555 | 4,645 | 4,371 | 4,662 | 4,534 | 5,513 | 5,007 | 4,727 |
| 2007 | 4,206 | 4,590 | 4,595 | 4,570 | 4,194 | 4,366 | 4,000 | 4,300 | 3,908 | 4,711 | 5,052 | 4,842 |
| 2008 | 4,732 | 4,757 | 4,583 | 5,156 | 4,441 | 3,897 | 3,579 | 3,902 | 3,997 | 4,613 | 4,937 | 4,500 |
| 2009 | 4,717 | 5,093 | 4,553 | 4,304 | 4,804 | 4,105 | 3,975 | 3,707 | 4,307 | 5,324 | 5,040 | 4,006 |
| 2010 | 3,994 | 4,490 | 4,106 | 4,750 | 4,689 | 4,148 | 3,744 | 3,702 | 4,292 | 5,531 | 5,799 | 4,175 |
| 2011 | 4,095 | 4,005 | 4,173 | 4,098 | 4,538 | 4,735 | 4,767 | 4,429 | 5,075 | 5,277 | 5,018 | 4,324 |
| 2012 | 5,071 | 4,544 | 4,521 | 5,089 | 4,586 | 4,360 | 4,039 | 4,534 | 4,169 | 4,264 | 4,214 | 3,799 |
| 2013 | 4,363 | 4,514 | 4,645 | 5,055 | 5,481 | 5,315 | 5,090 | 4,560 | 4,658 | 4,585 | 4,680 | 3,813 |
| 2014 | 4,721 | 5,229 | 5,599 | 6,176 | 6,471 | 5,980 | 4,665 | 4,692 | 4,420 | 5,903 | 4,918 | 4,291 |
| 2015 | 4,854 | 5,652 | 5,071 | 5,069 | 5,096 | 5,173 | 6,229 | 5,838 | 5,353 | 5,375 | 4,875 | 5,095 |
| 2016 | 5,295 | 5,306 | 4,807 | 4,155 | 4,407 | 4,544 | 4,963 | 4,465 | 4,375 | 4,382 | 4,706 | 4,663 |
| 2017 | 4,806 | 4,860 | 4,544 | 4,735 | 5,208 | 5,889 | 6,380 | 6,715 | 5,634 | 4,762 | 4,882 | 4,539 |
| 2018 | 4,890 | 4,834 | 4,628 | 4,039 | 4,088 | 4,698 | 4,832 | 5,005 | 5,697 | 5,018 | 5,231 | 4,575 |
| 2019 | 4,760 | 4,936 | 4,671 | 4,856 | 4,234 | 4,659 | 4,755 | 4,552 | 5,316 | 5,819 | 5,161 | 4,900 |
| 2020 | 4,641 | 5,288 | 5,167 | 5,622 | 4,299 | 4,682 | 5,010 | 4,749 | 4,764 | 4,299 | 3,995 | 3,937 |
| 2021 | 4,300 | 5,441 | 5,022 | 4,848 | 5,059 | 4,757 | 4,454 | 4,397 | 5,045 | 5,109 | 5,172 | 4,708 |
| 2022 | 4,133 | 4,267 | 5,013 | 5,070 | 5,416 | 5,654 | 5,417 | 4,730 | 4,826 | 5,303 | 5,164 | 5,254 |
| 2023 | 5,206 | 5,926 | 4,494 | 5,499 | 4,972 | 4,635 | 5,103 | 5,538 | 5,641 | 6,235 | 5,796 | 4,870 |
| 2024 | 4,810 | |||||||||||
| - = No Data Reported; -- = Not Applicable; NA = Not Available; W = Withheld to avoid disclosure of individual company data. |
| Release Date: 3/29/2024 |
| Next Release Date: 4/30/2024 |