|
Download Data (XLS File) |
|
||||||||
|
||||||||
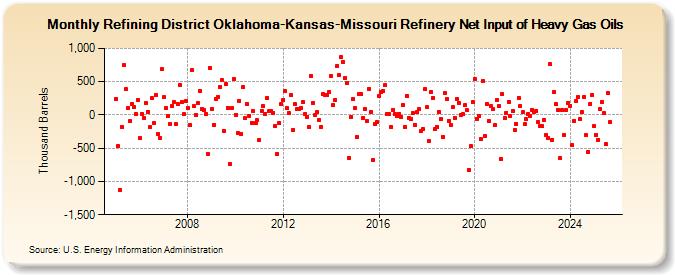
| Refining District Oklahoma-Kansas-Missouri Refinery Net Input of Heavy Gas Oils (Thousand Barrels) | ||||||||
| Year | Jan | Feb | Mar | Apr | May | Jun | Jul | Aug | Sep | Oct | Nov | Dec |
|---|---|---|---|---|---|---|---|---|---|---|---|---|
| 2005 | 242 | -473 | -1,122 | -175 | 747 | 383 | 102 | -97 | 165 | 122 | 17 | 230 |
| 2006 | -354 | 14 | -46 | 179 | 44 | -184 | 251 | -120 | 301 | -285 | -340 | 686 |
| 2007 | 265 | 102 | -20 | -137 | 139 | 187 | -141 | 170 | 455 | 188 | 11 | 207 |
| 2008 | 105 | -154 | 668 | 133 | 0 | 175 | 362 | 93 | 79 | 21 | -582 | 711 |
| 2009 | 92 | -147 | 241 | 269 | 421 | 518 | -235 | 463 | 109 | -733 | 103 | 538 |
| 2010 | 4 | -275 | 213 | -288 | 423 | -51 | 164 | -11 | -115 | 54 | -120 | -82 |
| 2011 | -370 | 63 | 134 | 14 | 261 | 54 | 57 | 33 | -168 | -586 | -125 | 159 |
| 2012 | 228 | 356 | 99 | 23 | 302 | -226 | 158 | 91 | 90 | 104 | 189 | 14 |
| 2013 | -26 | -177 | 582 | 184 | 3 | 44 | -76 | -175 | 307 | 303 | 303 | 348 |
| 2014 | 581 | 149 | 227 | 734 | 595 | 866 | 796 | 558 | 481 | -644 | -24 | 234 |
| 2015 | 102 | -332 | 313 | 312 | -39 | 86 | -89 | 396 | 43 | -677 | -138 | -108 |
| 2016 | 286 | 344 | 362 | 443 | 19 | 10 | -181 | 77 | 20 | -12 | 19 | -25 |
| 2017 | 150 | -177 | 290 | -44 | -62 | 26 | -147 | 38 | 83 | -249 | -216 | 385 |
| 2018 | 112 | -398 | 341 | 256 | -213 | -177 | 48 | -60 | -327 | 323 | 240 | -85 |
| 2019 | -147 | 118 | -42 | 246 | 181 | 0 | 7 | 143 | 72 | -824 | -473 | 189 |
| 2020 | 542 | -56 | -10 | -361 | 509 | -317 | 161 | -94 | 130 | 94 | -157 | 218 |
| 2021 | 130 | -659 | 311 | -44 | 36 | 200 | -17 | 58 | -226 | -129 | 257 | 132 |
| 2022 | 40 | -138 | -66 | 15 | -12 | 81 | 42 | 66 | -108 | -160 | -170 | -73 |
| 2023 | -299 | -344 | 758 | -376 | 350 | 159 | 77 | -652 | 70 | -309 | 75 | 185 |
| 2024 | 156 | |||||||||||
| - = No Data Reported; -- = Not Applicable; NA = Not Available; W = Withheld to avoid disclosure of individual company data. |
| Release Date: 3/29/2024 |
| Next Release Date: 4/30/2024 |